Introduction
Graphs are crucial structures in many fields. They connect data points, representing relationships. From mathematics to computer science, graphs help us visualize and analyze complex information. Different types, like bar graphs, line graphs, and network graphs, serve various purposes. Let’s dive deeper into graph theory and its practical uses.
If you’re looking to deepen your understanding of graph theory, consider checking out Introduction to Graph Theory. This book provides a comprehensive overview and is perfect for anyone starting out in this fascinating field.
Summary and Overview
A graph is a collection of vertices (nodes) connected by edges (lines). The basic components are simple yet powerful. Graph theory has a rich history, dating back to the 18th century. It began with Euler’s work on the Seven Bridges of Königsberg. Over time, it evolved into a vital area of study in mathematics and computer science.
Graphs are essential for data representation. They simplify complex data sets into understandable formats. In network analysis, graphs help us study connections and interactions. Algorithms developed using graphs enable efficient data processing and problem-solving.
Key applications of graphs include social networks, where users connect, and transportation systems, optimizing routes. Understanding graphs is fundamental for anyone interested in data science or mathematics. They provide a framework for solving real-world problems across various domains.

To better understand how graphs can be utilized in practical scenarios, consider exploring data visualization techniques for employment statistics in Duval County.
For those eager to tackle practical problems, Graph Theory: 30 Problems and Solutions offers a hands-on approach to mastering graph concepts. It’s perfect for honing your problem-solving skills!
What Are Graphs?
Definition and Components
In mathematics, a graph represents a collection of vertices and edges. Vertices, often called nodes, are the points in a graph. Edges are the lines connecting these points. Graphs can vary significantly. They can be undirected, where connections have no specific direction, or directed, where edges indicate a one-way relationship. Weighted graphs include edges with specific values, representing costs or distances.
Graphs are everywhere in today’s world. They are used in computer networks, social media platforms, and transportation systems. In fact, studies show that graph structures are essential in analyzing complex datasets. Their ability to illustrate relationships makes them invaluable across various fields.

To visualize these concepts effectively, consider using The Art of Data Visualization. This resource will transform your data representation skills and help you convey complex information more clearly.
The Basics of Graph Theory
Historical Context
Graph theory emerged in the 18th century, primarily through the work of mathematician Leonhard Euler. His famous Seven Bridges of Königsberg problem laid the groundwork for this fascinating field. Euler’s insights showed how to study connections using mathematical structures. This breakthrough was pivotal, as it introduced concepts of traversability and connectivity.
In the following centuries, graph theory expanded rapidly. Researchers like Gustav Kirchhoff applied it to electrical circuits, while others explored its applications in chemistry and biology. The introduction of algorithms in the 20th century further revolutionized graph theory. Concepts like connectivity, bipartiteness, and graph coloring became essential. Today, graph theory is a cornerstone in computer science, influencing algorithm design and data structure optimization.

If you’re interested in digging deeper into algorithms, Introduction to Algorithms is a must-read. It covers a range of algorithms in depth, making it an invaluable resource for both students and professionals.
Key Terminology
Understanding graphs requires familiarity with specific terms. Vertices are the fundamental units, while edges represent the connections between them. Paths are sequences of edges that link vertices, and cycles are paths that return to the starting point. Connectivity refers to the ability to reach one vertex from another.
Graphs can be classified into various types, such as trees, which are acyclic connected graphs, and bipartite graphs, where vertices can be divided into two distinct groups. The prevalence of these structures varies across disciplines. For instance, social networks often utilize undirected graphs, while directed graphs are common in web navigation and flowcharts. Understanding these terms and structures is crucial for effectively analyzing graphs and their applications.

Types of Graphs
Directed vs. Undirected Graphs
Graphs can be categorized as directed or undirected. In directed graphs, edges have a specific direction, indicating a one-way relationship. For example, a Twitter follow creates a directed edge from the follower to the followed. Conversely, undirected graphs feature edges without direction. A classic example is a Facebook friendship, where both users are connected mutually. Each type serves different purposes in applications. Directed graphs excel in scenarios like web page navigation, while undirected graphs are ideal for representing social networks.

To master graph structures, consider Graph Theory with Applications. This book explores real-world uses of graphs and enhances your understanding of their significance across different fields.
Weighted and Unweighted Graphs
Graphs can also be weighted or unweighted. In weighted graphs, edges carry values representing costs or distances, which are crucial in scenarios like network routing. For instance, in a transportation network, edges could indicate the distance between cities. Unweighted graphs, however, treat all edges equally, focusing solely on connectivity. They are often used in simple pathfinding algorithms where the distance or cost is irrelevant. Understanding the distinction helps in selecting the right graph type for various applications.

Special Graphs
Special types of graphs include trees, bipartite graphs, and complete graphs. Trees are acyclic graphs with a hierarchical structure, often used in computer science for data organization. Bipartite graphs consist of two distinct sets of vertices, useful for modeling relationships in matchmaking scenarios. Complete graphs connect every vertex to every other vertex, maximizing connectivity. Each special graph type has unique properties that make it suitable for specific applications, enhancing our ability to model and solve complex problems.

Applications of Graphs
In Computer Science
Graphs play a pivotal role in computer science. They serve as fundamental structures in algorithms and data organization. For instance, graph algorithms like Dijkstra’s find the shortest path in networks. They help in routing data efficiently, making them essential for internet functionality.
Moreover, graphs are crucial in data structures. Data can be represented as nodes connected by edges, facilitating quick access and manipulation. They also enhance problem-solving approaches. Many algorithms rely on graph structures to optimize tasks, such as network flow and scheduling.
Databases also benefit from graphs. Graph databases, like Neo4j, store data in a way that emphasizes relationships. This allows for efficient querying of interconnected data. Search engines use graphs to understand web page links, improving search results. By analyzing these connections, they deliver relevant content to users.

To dive deeper into graph algorithms, consider Dijkstra’s Algorithm Explained. This book breaks down the algorithm in an easy-to-follow manner, making it accessible for all readers.
In Real-World Networks
Graphs are the backbone of social networks. Platforms like Facebook and Twitter use graphs to illustrate user connections. Each user is a node, while relationships are the edges. This structure allows for easy navigation and interaction among users. For example, on Facebook, adding a friend creates a bidirectional connection.
Transportation systems also utilize graphs extensively. Consider a city’s transport network. Cities are nodes, while routes are edges connecting them. This representation helps in optimizing travel routes. Logistics companies employ graphs to manage delivery routes effectively. By analyzing these networks, they reduce costs and improve efficiency.
In summary, graphs provide a powerful way to model relationships in social and transportation networks, facilitating better decision-making.

In Data Visualization
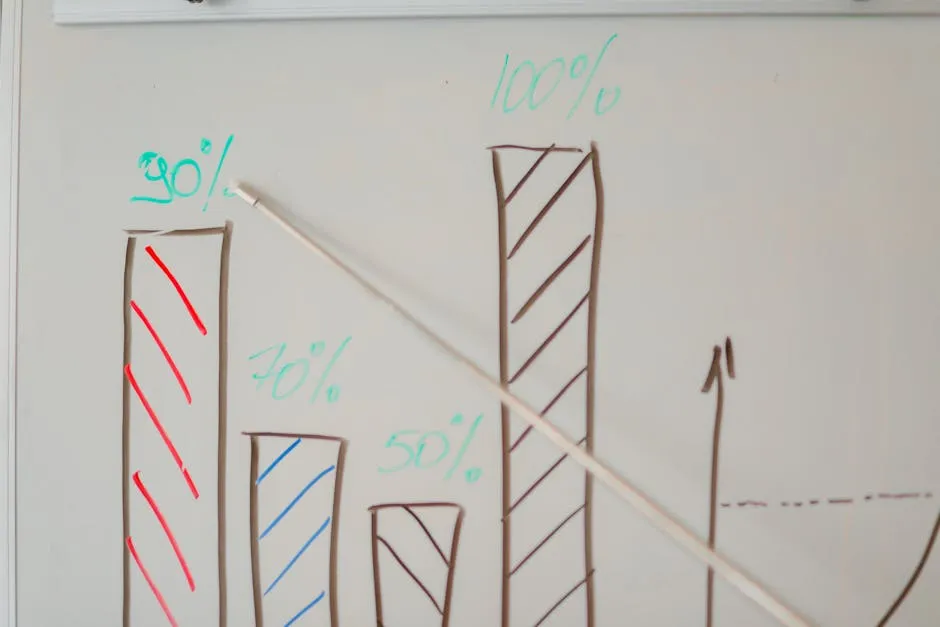
Graphs are excellent tools for visual data representation. They transform complex data sets into clear, understandable visuals. Bar graphs, line graphs, and pie charts help convey information at a glance. This clarity enhances communication and understanding.
Various software tools support graph creation and analysis. Microsoft Excel and Google Sheets allow easy graph generation. More advanced tools like Tableau and R provide deeper analytical capabilities. These tools enable users to create interactive visuals, making data analysis more engaging.
If you’re starting your journey with data visualization tools, Microsoft Excel 2021 for Beginners is a fantastic resource. It will help you harness the power of Excel for all your data needs!
Graph Algorithms
Basic Algorithms
Graph algorithms are essential for solving various problems. Three fundamental ones are Dijkstra’s algorithm, Breadth-First Search (BFS), and Depth-First Search (DFS).
Dijkstra’s algorithm finds the shortest path between nodes. It’s widely used in GPS navigation systems. Imagine planning a road trip; this algorithm helps you avoid traffic by finding the quickest route.
BFS explores all neighbors at the present depth before moving on. It’s useful for finding the shortest path in unweighted graphs. For example, when searching for a friend in your social network, BFS can quickly find the shortest connection.
DFS, on the other hand, goes as deep as possible down one path before backtracking. It’s handy for tasks like maze solving or scheduling problems. Understanding these algorithms is vital. They form the backbone of many applications in computer science and beyond.

Advanced Algorithms
Advanced graph algorithms tackle more complex scenarios. Examples include A* search, the Floyd-Warshall algorithm, and the Bellman-Ford algorithm.
The A* search algorithm combines features of Dijkstra’s and BFS, making it efficient for pathfinding in games. It uses heuristics to determine the optimal path, balancing speed and accuracy.
Floyd-Warshall is a dynamic programming method. It finds shortest paths between all pairs of nodes. This algorithm is vital in network analysis, helping businesses optimize routes and resources.
The Bellman-Ford algorithm can handle graphs with negative weights. It’s particularly useful in economic models where costs can fluctuate.
When considering efficiency, each algorithm has different complexities. A* and Dijkstra’s operate efficiently in polynomial time, while Floyd-Warshall has a cubic complexity. Understanding these nuances is crucial for selecting the right algorithm for your needs.

Conclusion
Understanding graphs is key to navigating many domains, from computer science to logistics. Their applications are vast and impactful. By exploring graph theory and its algorithms, you unlock tools to solve real-world problems.
If you’re looking for a comprehensive guide, The Complete Guide to Data Visualization is an excellent choice. It covers everything from basic principles to advanced techniques.
Please let us know what you think about our content by leaving a comment down below!
Thank you for reading till here 🙂
All images from Pexels

