Introduction
Data visualization transforms raw data into visuals. These visuals help us understand complex information easily. In today’s data-driven world, we see a surge in visual data representation across multiple fields. From business analytics to healthcare, effective visualization plays a crucial role. Let’s discuss best practices and techniques that enhance your data storytelling.
Summary and Overview
Data visualization is the art of presenting data graphically. It allows us to see trends, patterns, and outliers at a glance. The importance of data visualization has grown significantly over the years. It aids in data-driven decision-making, simplifying complex datasets for diverse audiences. Historically, data visualization has evolved from basic charts to intricate interactive displays. Today, it plays an essential role in communicating insights effectively. In this article, you will learn about various visualization types, tools, best practices, and how to avoid common pitfalls. By the end, you’ll be equipped to create compelling visualizations that resonate with your audience. If you’re starting your journey into data visualization, consider picking up a copy of Tableau Software: A Guide for Beginners. This book is perfect for diving into the world of data visualization and learning the ropes of one of the leading tools in the industry.What is Data Visualization?
Data visualization is the graphical representation of information. It uses visual elements like charts, graphs, and maps. This practice makes complex data easier to analyze and understand. One key benefit is clarity. Visuals can quickly reveal trends that might be hidden in raw data. Stakeholders can grasp information rapidly, leading to quicker decisions. Additionally, effective visuals can highlight relationships between different data points. This capability is crucial for data analysts, executives, and researchers alike. Visual representation also enhances engagement. People are naturally drawn to images and colors, making data more appealing. Whether in reports or presentations, visuals can support storytelling, making data relatable. Ultimately, data visualization transforms numbers into narratives that inform and inspire action.
Historical Context
Data visualization has a rich history, evolving significantly over centuries. The journey began in 1786 when William Playfair introduced the first graphical representations of data. His work laid the foundation for future visualizations. In the 19th century, Florence Nightingale utilized polar area charts to depict mortality rates in the Crimean War. This innovative approach highlighted the importance of visual data to influence public health policies. The 20th century saw the emergence of influential figures like Edward Tufte. Tufte’s book, The Visual Display of Quantitative Information, established key principles for effective data presentation. His emphasis on clarity and precision transformed how data was visualized. Today, advancements in technology enable interactive and dynamic visualizations. Tools like Tableau and D3.js allow users to create sophisticated graphics that reveal insights from complex datasets. This evolution continues to shape how we understand and communicate data in various fields.Types of Data Visualization
Common Visualization Types
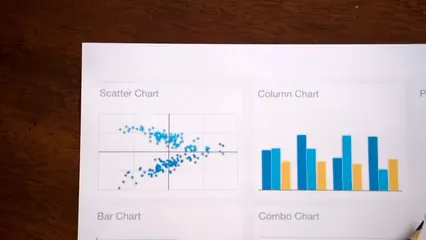
Data visualization comes in many forms, each serving a unique purpose. Here are some common types:- Bar Charts: Ideal for comparing quantities across categories. Use them when you want to highlight differences, like sales performance across regions.
- Line Graphs: Best for illustrating trends over time. They effectively show changes, making them perfect for stock price movements.
- Pie Charts: Useful for displaying proportions. They work well when you want to show parts of a whole, like market share among companies.
- Scatter Plots: Great for visualizing relationships between two variables. They help identify correlations, such as height versus weight.
- Histograms: Perfect for showing the distribution of numerical data. They are useful for understanding frequency, like age distribution in a population.

Advanced Visualization Techniques
While basic visualizations are useful, advanced techniques offer deeper insights. Here are a few:- Heat Maps: These visualize data density or intensity using color. They’re effective for showing patterns across geographical areas, like crime rates by neighborhood.
- Tree Maps: Useful for displaying hierarchical data. They represent data as nested rectangles, making it easy to compare parts of a whole, like sales by product category.
- Scatter Plots with Regression Lines: These not only show relationships but also predict trends. They are particularly valuable in studies aiming to forecast outcomes based on existing data.
- Box Plots: Ideal for summarizing data distributions. They provide insights into variability and outliers, helping to understand data spread.
Data Visualization Tools
Overview of Popular Tools
When it comes to data visualization, several tools stand out. Each offers unique features tailored to different needs. Let’s take a closer look at some of the most popular options. Tableau is a leader in the visualization space. It provides a user-friendly interface for creating interactive dashboards. Tableau excels in connecting to various data sources. Its drag-and-drop functionality allows users to build visuals quickly. It’s ideal for business intelligence and analytics teams. Power BI, developed by Microsoft, is another powerhouse. This tool integrates seamlessly with other Microsoft products. It offers robust data modeling capabilities. Users can create stunning reports and dashboards with ease. Power BI is great for organizations already using Microsoft tools. You can learn more about it in the book Power BI for Dummies. D3.js is a JavaScript library for web-based visualizations. It allows for highly customizable graphics. While it requires some coding knowledge, the flexibility is unmatched. D3.js is perfect for developers looking to create unique, interactive visuals. Google Data Studio is a free tool for creating reports and dashboards. It allows real-time collaboration and integrates with Google products. This is a great option for teams needing quick and easy data insights. If you’re keen on exploring recipes for effective data visualization, the Google Data Studio Cookbook is an essential read.
Understanding the right tools can significantly enhance your data visualization efforts. best data visualization tools for complex systems statistics can provide deeper insights into your options.
Open Source vs. Proprietary Tools
Choosing between open-source and proprietary tools can impact your data visualization journey. Open-source tools are often free, making them accessible to everyone. They encourage community contributions and provide flexibility. Examples include Plotly and Apache Superset. These tools offer powerful features without the cost of licenses. On the other hand, proprietary tools typically offer more polished user experiences and support. They may have advanced features and better customer service. However, they often come with licensing fees. For example, Tableau and Power BI charge based on usage. Ultimately, your decision should consider your budget, team skills, and specific project requirements. Both options have valid benefits, so weigh them carefully.
Best Practices for Data Visualization
Design Principles
Creating effective data visualizations requires adherence to design principles. First and foremost, clarity is key. Aim to present data in a straightforward manner. Avoid cluttering visuals with unnecessary elements. Simple designs often convey messages more effectively. Simplicity is another essential principle. Focus on the main message you want to communicate. Use colors and shapes that enhance understanding, not distract from it. Consider the audience’s perspective, as they will interpret your visuals. Tailor your designs to their knowledge levels and preferences. Accuracy is crucial. Ensure that your visualizations represent data truthfully. Misleading visuals can lead to confusion and poor decisions. Always double-check your data before presenting it. By following these principles, you can create impactful visualizations that resonate with your audience.
Avoiding Common Pitfalls
Creating effective data visualizations can be tricky. Many stumble into common mistakes that dilute their message. One major pitfall is using misleading scales. For instance, if you manipulate the Y-axis range, it can exaggerate trends or obscure important details. Always ensure your scales accurately represent the data. Another frequent error is cluttering visuals with too much information. Overloading a chart with unnecessary elements can confuse your audience. Simplicity is vital. Strive for a clean design that conveys your message clearly. To avoid these issues, start by defining your main message. What do you want your audience to understand? Choose a visualization type that best highlights this point. Use whitespace effectively to guide the viewer’s eye and separate different elements. Additionally, always label your axes and provide legends where necessary. This helps viewers understand what they’re looking at. Lastly, solicit feedback from peers. They can spot potential issues before you share your work widely. By taking these steps, you can create visuals that inform and engage without misleading your audience.
The Role of Interactivity in Data Visualization
Interactive visualizations take audience engagement to the next level. They allow users to explore data dynamically, leading to deeper insights. Imagine scrolling through a dashboard and filtering data in real-time. This interactivity helps users uncover patterns that static images might hide. For example, a financial dashboard might let users click on different regions to see sales performance. This immediate feedback keeps them invested in the data. It fosters a sense of discovery, encouraging users to explore further. Tools like Tableau and Power BI are great for creating such interactive experiences. They support features like drill-downs, allowing users to click on an element to reveal more details. This capability transforms data exploration into an engaging activity.
Tools for Creating Interactive Visualizations
When it comes to creating interactive visualizations, several tools shine. Tableau is popular for its user-friendly interface. It allows users to create dynamic dashboards with ease. Its drag-and-drop feature simplifies the process, making it accessible for non-technical users. Power BI also stands out, especially for those already using Microsoft products. It integrates well with other Microsoft tools, enhancing its functionality. Users can generate reports and visuals quickly, facilitating collaboration within teams. If you’re looking to dive deeper, consider reading Data Science for Business: What You Need to Know About Data Mining and Data-Analytic Thinking. D3.js is another powerful option, particularly for developers. This JavaScript library enables highly customizable graphics. While it requires coding skills, the flexibility it offers is unmatched. For those looking to create unique, interactive data stories, D3.js is an excellent choice. Lastly, Google Data Studio is a free tool worth considering. It allows users to create reports and share them easily. With real-time collaboration features, it’s perfect for teams that need quick insights. Each of these tools supports interactivity, ensuring your visualizations are engaging and informative.
Applications of Data Visualization
Use Cases Across Different Industries
Data visualization plays a vital role in various industries. In healthcare, it helps track patient data and disease outbreaks. For instance, dashboards visualize patient vitals, making it easier for doctors to spot trends quickly. In finance, companies utilize data visualization to analyze market trends and investment performance. A prominent example is stock market dashboards, which display real-time data, enabling investors to make informed decisions. Marketing teams also benefit from visual analytics. They use heat maps to identify customer behavior on websites. This insight helps optimize user experience and increase conversion rates. To keep your workspace organized while analyzing data, consider using an Office Desk Organizer.
Data Storytelling
Data storytelling combines data visualization with narrative techniques. It transforms raw data into compelling stories that resonate with audiences. This method enhances understanding and retention of information. A strong narrative guides viewers through data insights. It connects disparate data points, making the information relatable. For example, using visuals to depict climate change trends can evoke emotional responses. This engagement encourages action. Effective data storytelling requires a clear structure. Begin with an introduction, present key insights, and conclude with a call-to-action. This approach ensures the audience remains engaged throughout the presentation.
Conclusion
In summary, data visualization is crucial for making sense of information. It empowers organizations to make data-driven decisions and communicate insights effectively. By applying best practices and exploring various visualization tools, you can enhance your data storytelling capabilities. Start implementing these techniques today for greater impact in your work. And if you’re looking to stay connected while on the go, a Smartwatch could be a perfect addition to your tech collection.Please let us know what you think about our content by leaving a comment down below!
Thank you for reading till here 🙂
All images from Pexels


