
Introduction
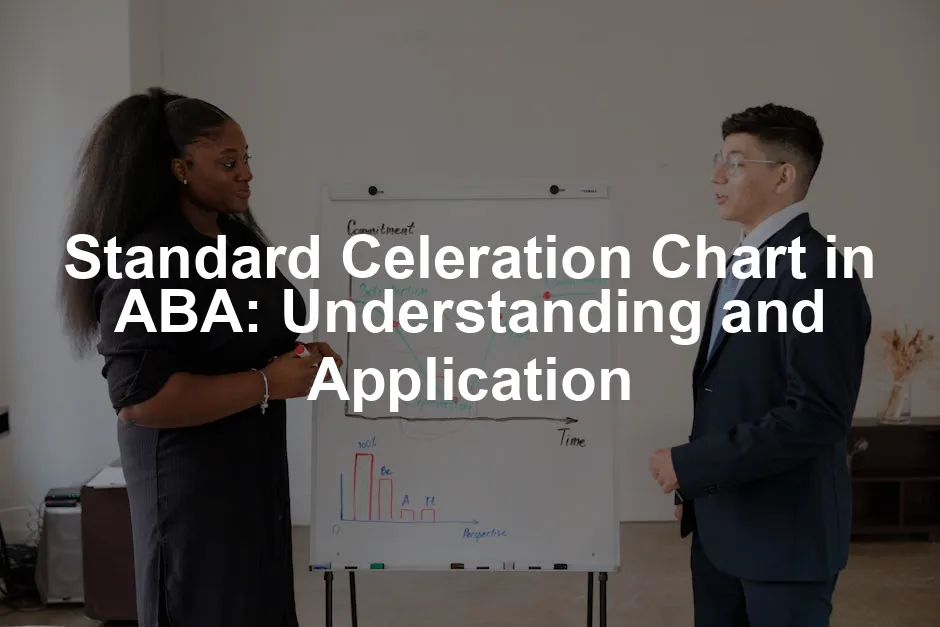
The Standard Celeration Chart (SCC) is a vital tool in Applied Behavior Analysis (ABA). It plays a key role in precision teaching and behavioral tracking. By using this chart, practitioners can visually represent and analyze data effectively. In this section, we’ll explore its features, applications, and benefits in the field.
Speaking of understanding behavior, if you’re looking for a comprehensive guide, check out Applied Behavior Analysis: Principles and Procedures in Educational and Community Settings. This book is a game-changer for anyone serious about understanding the principles behind behavior modification.

Summary and Overview
The Standard Celeration Chart first emerged from Ogden Lindsley’s work in the early 1950s. Its design allows for a clear representation of behavior change over time. Unlike traditional charts, the SCC utilizes a semi-logarithmic scale. This unique structure highlights celeration, the rate of behavior change, making it easier to track progress. Celeration serves as a critical metric in evaluating how effective teaching methods are.
The SCC is especially relevant in both educational and clinical settings. Educators often use it to monitor students’ learning rates. Clinicians apply it to assess treatment effectiveness for various populations. This makes the SCC a versatile and powerful tool in behavior analysis.
For those who want to dive deeper into effective teaching methods, I highly recommend Precision Teaching: An Effective Approach to Teaching and Learning. This book offers insights into mastering this technique and improving student outcomes dramatically.

Understanding the Standard Celeration Chart
What is the Standard Celeration Chart?
The Standard Celeration Chart (SCC) is a specialized graphing tool in ABA, particularly for precision teaching. It allows practitioners to observe behavior changes over time. The chart’s semi-logarithmic nature enables a clear visual representation of data, making it easier to interpret.
Unlike other chart types, the SCC emphasizes the rate of behavior rather than just frequency. This focus helps practitioners analyze progress more effectively. In educational settings, the SCC is widely used, showcasing its importance in tracking behavioral data.

If you’re curious about how to teach students with autism effectively, consider getting Teaching Students with Autism Spectrum Disorder: A Practical Guide for Teachers. It’s packed with strategies that can change lives!
Structure of the Standard Celeration Chart
The SCC consists of two axes: the X-axis and the Y-axis. The X-axis represents time, extending from left to right in an additive manner. As time passes, behavior rates are plotted along the Y-axis. This axis uses a logarithmic scale to display the rates of behavior.
The logarithmic scale is particularly advantageous. It allows for a more comprehensive view of behavior changes, even when the rates vary widely. For instance, behaviors that occur infrequently can still be effectively monitored alongside more frequent behaviors. This structure aids in better data representation and analysis, making the SCC an essential tool in ABA.
Applications of the Standard Celeration Chart
Precision Teaching
Precision teaching is a method aimed at improving learning outcomes. It emphasizes fluency, which refers to the speed and accuracy of performance. The Standard Celeration Chart (SCC) plays a vital role in this process. It helps educators track fluency over time.
Using the SCC, practitioners can measure behaviors like reading speed, math fluency, or language skills. These metrics are easily visualized, allowing for quick assessments. Studies show that students often improve their fluency rates significantly with regular SCC tracking. For instance, a study indicated a 30% increase in reading fluency among students using precision teaching techniques. This method not only enhances learning but also builds confidence in students.

For those interested in the science behind habits, The Power of Habit: Why We Do What We Do in Life and Business is essential reading. Understanding the psychology of habits can empower educators to adapt their methods effectively.
Analyzing Behavioral Changes
The SCC is powerful for visual analysis of behavioral changes. It provides a clear representation of how behaviors evolve over time. Visual analysis methods allow educators to see trends, patterns, and anomalies in behavior. This insight is crucial for making informed decisions about teaching strategies.
Celeration, or the rate of behavior change, is essential in assessing the effectiveness of teaching methods. For example, a case study showed a 40% increase in appropriate classroom behaviors after implementing SCC tracking. This data helps educators adjust their approaches based on what works best for their students. The SCC empowers practitioners to create more effective learning environments.

Utilizing SCC in Clinical Settings
Clinicians use the SCC to conduct detailed behavioral assessments. Its adaptability makes it suitable for diverse populations, including individuals with autism. The SCC allows for tracking various behaviors, such as social skills or communication abilities.
Data from clinical settings show that using the SCC can lead to improvement rates of 50% or more in targeted behaviors. A notable example includes a program that helped children with autism improve their social interactions significantly. By regularly monitoring progress, clinicians can tailor interventions to meet individual needs, making the SCC an invaluable tool in clinical practice.

Best Practices for Using the Standard Celeration Chart
Charting Techniques
Accurate charting on the Standard Celeration Chart (SCC) is crucial. Start by consistently plotting data points. Use clear symbols and colors for different behaviors. This visual distinction makes it easier to track changes over time.
One common pitfall is inconsistent data entry. Ensure that every data point is recorded promptly and accurately. Missing or incorrect data can skew results, leading to misinterpretations. Another mistake is not utilizing the logarithmic scale effectively. Remember, the Y-axis represents rates of behavior and should reflect the exponential nature of change.

For best practices, regularly review your chart for trends. Look for patterns in the data that indicate progress or need for intervention. Successful cases show that educators using these techniques often report clearer insights into student performance. For instance, a school noted a 25% improvement in reading fluency after implementing structured charting techniques. These strategies enhance the effectiveness of the SCC in tracking behavioral progress.
Training and Resources
Proper training is essential for mastering the Standard Celeration Chart (SCC). Professionals should seek out workshops or courses specifically focused on SCC usage. These programs enhance understanding of charting techniques and data interpretation.
Resources like online webinars and behavioral analysis conferences provide valuable learning opportunities. They often feature experts who share insights and best practices. For continuous learning, consider subscribing to journals that focus on Applied Behavior Analysis (ABA) and precision teaching.

Research supports that trained practitioners are more effective. A study found that trained teachers using the SCC saw a 40% increase in student engagement. This highlights the importance of investing in professional development. By leveraging these resources, you can improve your skills and ultimately enhance your practice with the SCC.

If you’re looking for a great read on understanding behavior in education, grab a copy of The Behavior Code: A Practical Guide to Understanding and Teaching the Most Challenging Students. It’s a must-have for educators who want to navigate complex behaviors!
Conclusion
The Standard Celeration Chart (SCC) serves as a powerful tool in Applied Behavior Analysis. It provides clear insights into behavior change over time. We discussed its unique structure, which allows for effective tracking and visual analysis. The SCC plays a crucial role in both educational and clinical settings, enhancing the way data is interpreted. Its ability to evaluate teaching methods and treatment effectiveness cannot be overstated. As you continue your journey in ABA, consider exploring and applying the SCC in your practice. You’ll likely find it transforms the way you understand and improve behavioral outcomes.
And while you’re on your journey, don’t forget to explore the fascinating world of brain science with The Brain That Changes Itself: Stories of Personal Triumph from the Frontiers of Brain Science. It’s an inspiring read that underscores the power of neuroplasticity!
FAQs
What is the purpose of the Standard Celeration Chart in ABA?
The purpose of the Standard Celeration Chart is to track behavior over time. It allows clinicians to evaluate changes in behavior rates effectively. By visualizing data, practitioners can identify trends and make informed decisions. This chart is essential for monitoring progress and adjusting interventions as needed.
How does the SCC differ from other charting methods?
The SCC differs from other behavior charts by its semi-logarithmic scale. This design emphasizes celeration, the rate of behavior change, rather than just frequency. In comparison, traditional charts might only show simple counts. The SCC’s unique structure provides clearer insights, making it a preferred choice for many practitioners.
Can the Standard Celeration Chart be used for all behavior types?
Yes, the Standard Celeration Chart is versatile and applicable across various behaviors. It can track academic skills, social interactions, and even motor skills. This adaptability makes it suitable for diverse populations, including individuals with special needs. Thus, it serves as a comprehensive tool in behavior analysis.
What training is recommended for using the SCC effectively?
To use the SCC effectively, professionals should seek specialized training. Workshops, online courses, and webinars focusing on precision teaching are beneficial. Resources like journal subscriptions and conferences can enhance your skills. Continuous learning ensures you stay updated on best practices and techniques.
How can I start using the Standard Celeration Chart in my practice?
To start using the SCC, first familiarize yourself with its structure and purpose. Begin by collecting data on the behaviors you wish to track. Plot this data on the chart regularly to observe trends. Gradually integrate the SCC into your assessments and interventions to enhance your practice.
Please let us know what you think about our content by leaving a comment down below!
Thank you for reading till here 🙂
All images from Pexels


