Statistics in Everyday Life: Understanding its Impact and Applications
Introduction
Statistics is more than just numbers—it’s the art of understanding data. In a world overflowing with information, statistics helps us make sense of it all. Whether we’re analyzing survey results, tracking health trends, or forecasting the weather, the significance of statistics spans multiple fields, including science, business, and social sciences.
Everyday decisions often hinge on statistical information. Think about it: when you choose a restaurant based on online reviews, you’re relying on statistics. Or when you check the weather app to decide if you need an umbrella. These decisions showcase how statistics permeate our daily lives, guiding us through complex choices.
The purpose of this article is to illuminate how statistics shapes our everyday experiences. We’ll explore its applications, from health assessments to financial decisions, revealing the benefits it offers. By understanding statistics, you’ll be better equipped to navigate life’s uncertainties and make informed choices.

1. What Are Statistics?
1.1 Definition and Importance
Statistics is the discipline that involves collecting, analyzing, interpreting, and presenting data. In simpler terms, it helps us understand what the numbers mean. Imagine it as a tool that gives context to the chaos of data. It plays a crucial role in decision-making, allowing businesses to optimize operations and governments to implement effective policies.
In healthcare, for instance, statistics help evaluate treatment outcomes and track disease outbreaks. In economics, businesses rely on statistical analysis to predict market trends and consumer behavior. The importance of statistics cannot be overstated; it transforms raw data into actionable insights across various sectors.
For those looking to deepen their understanding of statistics, consider picking up “The Art of Statistics: Learning from Data” by David Spiegelhalter. This book is a fantastic resource for anyone eager to navigate the world of data with confidence!
1.2 Types of Statistics
Statistics can be broadly categorized into two types: descriptive and inferential. Descriptive statistics summarize data, providing an overview through measures such as mean, median, and mode. For example, a teacher might use descriptive statistics to summarize student test scores, revealing the average performance of the class.
Inferential statistics, on the other hand, allows us to make predictions or generalizations about a larger population based on a sample. For instance, pollsters use inferential statistics to predict election outcomes based on surveys conducted with a small group of voters. Each type serves a unique purpose, essential in transforming data into meaningful information that drives our decisions.
2. Everyday Applications of Statistics
Statistics is more than just a bunch of numbers; it’s the magic wand that helps us decode the mysteries of life. From predicting the weather to understanding our health, statistics plays a vital role in our everyday decisions. Let’s dive into some specific areas where statistics shines bright.
2.1 Health and Medicine
In the realm of health and medicine, statistics is a superhero. It’s used to analyze data from clinical trials, track disease outbreaks, and evaluate treatment effectiveness. For instance, during the COVID-19 pandemic, statistical analysis helped determine vaccine effectiveness. Researchers examined data from thousands of participants. They evaluated how many got infected after vaccination compared to those who remained unvaccinated. This data-driven approach allowed health officials to understand the vaccine’s impact and guide public health policies.
Statistics also play a crucial role in predicting disease trends. By examining past data, health professionals can forecast potential outbreaks and identify at-risk populations. This proactive approach helps in allocating resources effectively and implementing preventive measures. Without statistics, we’d be like a doctor without a stethoscope—lost and guessing!
If you’re intrigued by the intersection of data and health, check out “Statistics for Dummies” by Deborah J. Rumsey. This book breaks down complex concepts into digestible pieces, making it a must-have for those venturing into the world of statistics!

2.2 Weather Forecasting
Ever wondered how the meteorologist knows it’s going to rain on Tuesday? You guessed it! Statistics gives them the scoop. Meteorologists use statistical models to analyze historical weather patterns alongside current data. They crunch numbers, analyze probabilities, and voilà! A weather prediction is born.
For example, when you hear that there’s an 80% chance of rain tomorrow, that number is rooted in complex statistical calculations. These calculations consider past weather conditions, geographical data, and real-time observations from satellites. This statistical wizardry allows us to plan our outdoor adventures (or our Netflix binges) accordingly. Who wants to be caught in the rain without an umbrella? Not me!
Speaking of umbrellas, make sure you’re prepared for unexpected weather with a reliable Umbrella. You’ll thank yourself when the clouds open up!
2.3 Finance and Economics
In finance, statistics is the trusty sidekick of investors and economists. It empowers them to make informed decisions. Stock analysts, for example, use historical data to predict market trends. They analyze price movements, volume, and even economic indicators to anticipate future stock performance.
Imagine an investor trying to decide whether to buy shares in a tech company. They’ll look at statistical trends, like the company’s past earnings reports and market behaviors. This analysis helps them gauge the risk involved. The more data they have, the better their chances of making a profitable decision. In the world of finance, statistics is the compass guiding investors through the stormy seas of market volatility.
If you’re serious about investing, grab a copy of “The Intelligent Investor” by Benjamin Graham. This classic guide offers timeless wisdom for anyone looking to navigate the investment landscape!

2.4 Education
Statistics in education helps assess student performance and improve teaching methods. Schools and universities rely on standardized testing to evaluate how well students are learning. They analyze test scores to identify trends and gaps in knowledge.
For instance, if a significant number of students struggle with math, educators can review their teaching strategies. They might implement targeted interventions or additional resources to help students succeed. This statistical approach ensures that no student gets left behind, creating a more equitable educational environment. In essence, statistics acts as a report card for the education system itself.
To enhance your understanding of educational statistics, consider reading “Statistics Explained” by Steve McKillup. It’s a great resource to understand how statistics impact education!

In conclusion, statistics is a powerful tool that weaves through our everyday lives. From health to finance, weather, and education, it helps us make sense of the world. So the next time you check the weather or consider an investment, remember: behind those numbers lies a world of statistical wonder!
Statistics also play a crucial role in education, helping to assess student performance and improve teaching methods. For more insights on this topic, check out our education statistics digest.
2.5 Quality Control in Manufacturing
In the manufacturing world, statistics are the unsung heroes of quality control. These numerical wizards help industries maintain product standards and ensure consumer safety. Imagine walking into a store and finding a product that’s perfectly crafted every time. Thanks to statistical methods, this is possible!
Manufacturers utilize statistical sampling techniques to monitor quality. Rather than inspecting every single item, they select a representative sample from a batch. This method is efficient and cost-effective. If a factory produces thousands of widgets daily, inspecting each one would be impractical—think of the time, labor, and caffeine required!
Let’s say a company produces lightbulbs. They might randomly select 100 bulbs from a production run and test them for brightness and durability. If 95 out of 100 perform well, that’s a solid quality assurance indicator. But if only 70 pass the test, alarms go off—literally! This data-driven approach enables manufacturers to identify defects early, reducing waste and enhancing customer satisfaction.
Furthermore, these statistical techniques help in refining manufacturing processes. By analyzing defect rates, companies can pinpoint areas that need improvement. For instance, if a high proportion of defective items comes from a specific machine, it might be time for maintenance or even replacement.
In essence, statistics serve as the backbone of quality control in manufacturing. They transform raw data into actionable insights, ensuring products meet the highest standards. So, the next time you grab a well-made item, remember: statistics played a significant role in getting it to your hands!

3. Statistics in Decision-Making
3.1 Personal Finance
Statistics heavily influence how individuals manage their personal finances. From budgeting to investing, statistical data guides your decisions. Let’s face it, no one wants to end up broke because they ignored the numbers!
Take budgeting, for example. By analyzing past spending habits, individuals can spot patterns. Perhaps you notice a monthly spike in dining expenses. With this data in hand, you can adjust your budget to save for that dream vacation or new gadget. It’s like having a financial GPS that helps you navigate your money!
To help you manage your finances better, check out a Home Budgeting Planner. It’s an excellent tool to track your income and expenses, ensuring you stay on top of your finances!

3.2 Marketing and Consumer Behavior
Businesses today harness the power of statistics to decode consumer behavior and market trends. It’s like having a crystal ball that reveals what customers want. Marketers analyze data to tailor their strategies effectively, ensuring they hit the mark every time.
Market research techniques are pivotal. Companies collect data through surveys, social media monitoring, and sales analysis. By doing so, they uncover insights about customer preferences. For instance, if surveys reveal that consumers favor eco-friendly products, companies can adjust their offerings accordingly.
Statistical analysis also helps in segmenting markets. Businesses can categorize customers based on demographics, purchasing habits, or interests. This segmentation enables targeted advertising, maximizing the impact of marketing campaigns. Picture receiving an ad for that gadget you’ve been eyeing—thanks to statistics, businesses know just what to show you!
Moreover, A/B testing is another statistical technique used in marketing. Companies experiment with two versions of a product or advertisement to see which performs better. By analyzing the results, they can make data-driven decisions, enhancing their overall marketing effectiveness.
In essence, statistics are the heartbeat of marketing strategies. They empower businesses to understand consumer behavior and optimize their approaches. The result? Happier customers and healthier profits!

3.3 Political Campaigns
Statistics play a pivotal role in shaping political campaigns. They help gauge public opinion and forecast election outcomes. Picture this: a candidate is preparing for an election, and they need to know where they stand. Enter polling data!
Polls collect statistical data about voter preferences and attitudes. By surveying a representative sample, campaign teams can predict how different demographics will vote. This information allows candidates to tailor their messages to resonate with specific voter groups. For instance, if younger voters show strong support for climate change initiatives, a candidate may prioritize those issues in their campaign.
Moreover, statistical analysis helps campaigns allocate resources efficiently. If data reveals that a particular region is leaning towards a candidate, they can focus their efforts there. This strategic approach maximizes the impact of campaign resources and increases the likelihood of success.
Election forecasting is another area where statistics shine. Media outlets often use statistical models to predict outcomes based on polling data and historical trends. These projections can influence voter turnout and campaign strategies as candidates adjust their tactics based on what the numbers suggest.
In conclusion, statistics are the backbone of modern political campaigns. They inform strategies, shape messaging, and help candidates connect with voters. So, the next time you hear about polling data, remember its importance in the political landscape!
4. Limitations and Misinterpretations of Statistics
4.1 Common Pitfalls
Statistics plays a huge role in our lives, but it isn’t without flaws. Misinterpretations can lead to poor decisions. Let’s explore some common pitfalls and the importance of critical thinking.
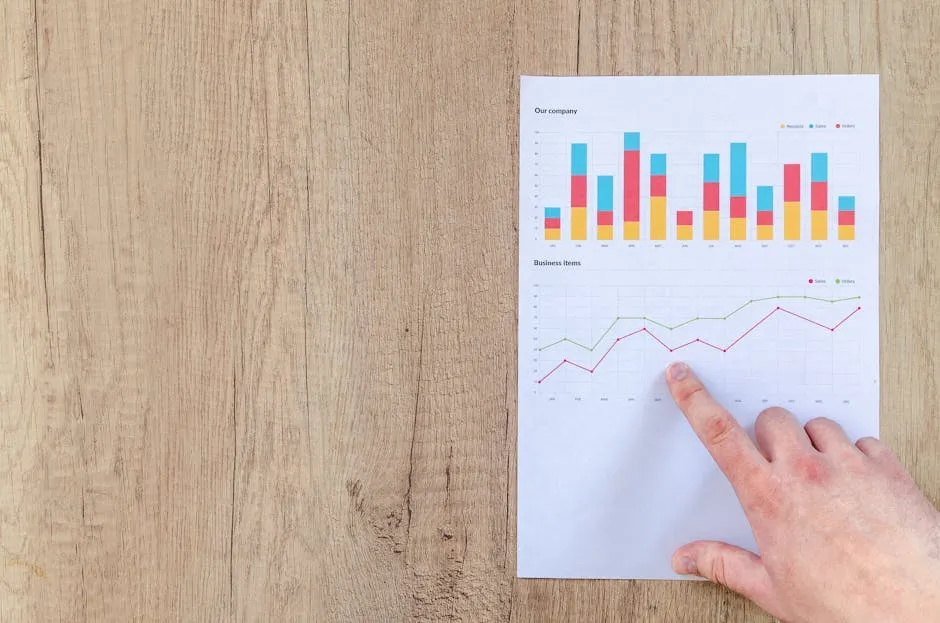
Statistics can be tricky, like a magician’s sleight of hand. Misleading graphs are often the culprit. Ever seen a bar graph where one bar towers over the others? It might look impressive, but without proper context, it can mislead. Scale manipulation can exaggerate differences, turning a minor issue into a major scare.
Another common pitfall? Misuse of statistical methods. For instance, correlation does not imply causation. Just because two trends move together doesn’t mean one causes the other. Think of it like this: ice cream sales and drowning incidents both rise in summer. But don’t blame the ice cream!
Sample bias is another tricky area. When data comes from a non-representative sample, conclusions can be flawed. If a survey about local restaurants only includes responses from food bloggers, how valid is that? It’s like asking a cat to judge a dog show—totally out of context!
4.2 Importance of Critical Thinking
Critical thinking is essential when interpreting statistics. Don’t just take numbers at face value. Begin by asking questions. Who conducted the study? What were the sample sizes? How was the data collected?
Evaluating statistical claims in media and advertising is crucial. When you see a headline shouting, “90% of people prefer Brand X!” check for the details. What’s the sample size? Was it conducted in a controlled environment?
Another tip: look for peer-reviewed studies. These have undergone scrutiny from experts, adding credibility.
Lastly, familiarize yourself with common statistical terms. Understanding basic concepts like mean, median, and standard deviation will help you better evaluate claims. It’s like learning the rules before playing a game—knowledge is power!
5. The Future of Statistics in Daily Life
Statistics is evolving, thanks to technology. Big data and artificial intelligence are at the forefront of this transformation. The future looks bright!
Big data involves analyzing vast amounts of information. Businesses can now track customer behavior in real-time. Imagine shopping online and receiving personalized recommendations based on your browsing history. That’s the power of statistics in action!
AI is another game changer. It can identify patterns and trends faster than any human could. For example, in healthcare, AI analyzes patient data to predict disease outbreaks. This proactive approach can save lives.
Moreover, as wearable technology becomes more common, personal health stats will be collected continuously. This data can help individuals make informed choices about their health. Think of it as having a personal trainer in your pocket!
To help you navigate your health, consider investing in a Smartphone with Advanced Health Tracking Features. This way, you can keep tabs on your fitness journey effortlessly!

In summary, advancements in technology will enhance how we apply statistics in everyday life. From personalized shopping experiences to proactive health management, the future is full of potential. Embrace the change, and let statistics guide you!
FAQs
What are some common uses of statistics in daily life?
Statistics are everywhere, helping us in various fields. In health and medicine, they analyze clinical trial data to determine treatment effectiveness. In finance, individuals use statistics to make informed investment decisions based on historical trends. Weather forecasting relies heavily on statistical models to predict conditions, while education uses statistical analysis to assess student performance. Even in marketing, businesses analyze consumer behavior statistics to tailor their strategies effectively. Statistics also play a role in urban planning, traffic management, and public policy decision-making, ensuring that services meet community needs.
How can I improve my statistical literacy?
Improving statistical literacy starts with education. Consider taking online courses or workshops that focus on basic statistics and data interpretation. Websites like Khan Academy and Coursera offer valuable resources. Reading books on statistics can also help; titles like ‘How to Lie with Statistics’ by Darrell Huff explain concepts in a relatable way. Practice interpreting graphs and charts in everyday contexts, such as news articles or financial reports. Engaging in discussions with knowledgeable individuals or joining study groups can further enhance your understanding of statistics and their applications.
What are the different types of statistical analyses?
Statistical analyses can be broadly categorized into descriptive and inferential statistics. Descriptive statistics summarize data, giving a clear overview through measures like mean (average), median (middle value), and mode (most frequent value). For instance, a teacher might use descriptive statistics to summarize class performance on a test. Inferential statistics, on the other hand, allows us to draw conclusions about a larger population based on a sample. This includes techniques like correlation, which measures the relationship between two variables, and regression analysis, used to predict outcomes based on data trends.
How do statistics influence public policies?
Statistics are essential for shaping effective public policies. They provide a factual basis for decision-making, helping policymakers understand the needs of the population. For example, census data informs resource allocation for schools, hospitals, and public transportation. During public health crises, statistics guide responses, such as vaccination campaigns and health advisories. Additionally, statistical analysis helps assess the effectiveness of policies by tracking outcomes and making necessary adjustments. In essence, statistics enable governments to make informed, transparent, and accountable decisions that benefit society as a whole.
Please let us know what you think about our content by leaving a comment down below!
Thank you for reading till here 🙂
And if you’re looking to spice up your cooking, grab a copy of “The Joy of Cooking”. This cookbook is a classic that can help you whip up delicious meals while you ponder the statistics of your culinary adventures!
Lastly, don’t forget to check out Cooking Utensils Set to make your cooking experience even more enjoyable!
All images from Pexels


