Introduction
Business statistics is not just a bunch of numbers; it’s the backbone of smart decision-making in today’s fast-paced business environment. Imagine trying to steer a ship without a compass. That’s what running a business without statistics would feel like! These statistical methods provide insights that help organizations make informed choices, reducing risks and enhancing efficiency.
This guide will walk you through the world of basic business statistics. You’ll learn key concepts, applications, and useful tools that can transform raw data into actionable insights. Whether you’re a budding entrepreneur or a seasoned manager, understanding these concepts will elevate your decision-making game.
The relevance of business statistics spans across various sectors. In finance, statistics help analyze market trends and manage risks. In marketing, they guide customer segmentation and campaign performance evaluation. Operations teams use statistics to optimize processes and improve quality control. With this guide, you’ll be equipped to apply statistical reasoning in multiple business contexts, ensuring you’re always a step ahead in the decision-making process.

If you’re looking to take your statistical knowledge to the next level, grab a copy of Excel 2019 for Dummies. This guide will help you master Excel, the Swiss Army knife of data analysis!
Understanding Basic Business Statistics
What is Business Statistics?
Business statistics is the science of collecting, analyzing, and interpreting data to inform business decisions. It plays a pivotal role in the business landscape, allowing companies to make sense of the overwhelming amount of data they generate daily. By applying statistical techniques, businesses can identify trends, forecast outcomes, and ultimately drive strategic initiatives.
In today’s data-driven world, making decisions based solely on gut feeling is like throwing darts blindfolded. Data-driven decision-making takes center stage. It enables businesses to rely on factual evidence rather than assumptions. This approach minimizes errors and maximizes the chances of success.
For instance, a retail company analyzing sales data can determine which products are bestsellers, allowing them to optimize inventory levels. Similarly, a marketing team can use customer data to tailor campaigns, improving engagement rates and return on investment. By embracing business statistics, organizations can enhance their operational efficiency, ultimately leading to increased profitability and competitiveness.
Looking for a deeper understanding of statistical concepts? Consider picking up The Art of Data Science. It’s a fantastic resource for anyone looking to master the nuances of data analysis!
The journey into business statistics may seem daunting, but fear not! With the right tools and knowledge, anyone can harness the power of data analysis to make informed decisions. So, let’s roll up our sleeves and dive into the essential concepts that form the foundation of business statistics.

Key Concepts in Business Statistics
When diving into business statistics, it’s crucial to grasp a few foundational terms. Let’s break it down.
Population refers to the entire group we want to study. Think of it as the whole pie. A sample, on the other hand, is just a slice of that pie, representing a smaller portion of the population. We use samples because studying the entire population can be impractical and expensive. To learn more about this concept, check out this article on population of interest statistics.
Understanding the distinction between population and sample is vital in statistics. Learn more about population of interest statistics here.
Next up, we have variables. These are characteristics or attributes that can vary among the subjects in our population. For instance, age and income are variables that can differ from person to person. Data can be classified into different types: quantitative (numerical data) and qualitative (categorical data). Quantitative data can be further divided into discrete (countable) and continuous (measurable). Qualitative data includes categories like colors or types of products.
Now, let’s tackle the difference between descriptive and inferential statistics. Descriptive statistics summarize and describe the features of a dataset. They provide insights such as averages or percentages to give a quick overview. Inferential statistics, however, take it a step further. They allow us to make predictions or generalizations about a population based on a sample. Think of it as guessing the flavor of an ice cream tub based on just one spoonful.
If you’re curious about statistical analysis using software, grab a copy of Statistical Analysis with Excel For Dummies. It’s a great resource for anyone looking to dive deeper into Excel’s capabilities!

Applications of Business Statistics
Business statistics are like a Swiss Army knife for organizations, useful in various ways. One major application is market research. Companies use statistics to analyze consumer behavior and preferences. For example, a beverage company might survey customers and use statistical analysis to determine the most popular flavors.
Quality control is another area where statistics shine. Businesses implement statistical process control (SPC) to monitor production processes. For instance, a car manufacturer might track defect rates using control charts. This helps identify issues early, ensuring only top-notch cars roll off the assembly line.
Financial forecasting also heavily relies on statistics. Companies analyze historical sales data to predict future revenue. For example, an online retailer may use past holiday sales data to forecast inventory needs for the upcoming season. You can explore recent trends in this field in our article on recent trends in data analysis for financial forecasting 2024.
Financial forecasting is crucial for business success. Discover recent trends in data analysis for financial forecasting here.
Real-world examples abound! Take Amazon, for instance. They analyze customer purchasing patterns through statistics to tailor product recommendations. Similarly, Netflix uses viewer data to determine what shows to produce next, ensuring they hit the mark with their audience.
In essence, statistics provide businesses with the insights needed to navigate the complexities of the market confidently. Whether it’s optimizing production, enhancing customer satisfaction, or making informed financial decisions, understanding and applying statistics is paramount for success.

Interested in learning about data visualization? Check out Data Visualization: A Practical Introduction. It’s a fantastic guide to making sense of your data visually!
Probability Concepts
Basics of Probability
Probability theory is like the seasoning in your favorite recipe—it enhances everything! In business statistics, it helps quantify uncertainty. When making decisions, understanding probability allows businesses to estimate risks and make informed choices.
At its core, probability measures how likely an event is to occur. The probability of an event ranges from 0 (impossible) to 1 (certain). For example, flipping a coin has a probability of 0.5 for landing on heads or tails.
There are some basic rules to remember. The Addition Rule states that the probability of either event A or event B occurring is the sum of their probabilities, minus the probability of both happening together. The Multiplication Rule is used for independent events, calculating the probability of both A and B occurring by multiplying their individual probabilities.
Another fun concept is conditional probability, which looks at the likelihood of an event occurring, given that another event has already occurred. This is crucial for businesses when analyzing customer behavior or market trends.
Understanding these concepts lays the groundwork for more complex statistical analysis in business.

Probability Distributions
Now, let’s spice things up with probability distributions! These distributions categorize the likelihood of outcomes. There are two main types: discrete and continuous.
Discrete probability distributions deal with countable outcomes. Take the binomial distribution, for instance. It’s perfect for scenarios where there are two possible outcomes, like success or failure. Businesses often use it in quality control to determine the number of defective items in a batch.
On the other hand, continuous probability distributions apply to outcomes that can take any value within a range. The normal distribution is the star here! This bell-shaped curve is widely used in business statistics. It can model everything from customer heights to sales figures. Many business processes assume normality, making it essential for forecasting and trend analysis.
Before we move on, if you’re interested in diving deeper into statistical methods, check out R for Data Science. It’s a great resource for learning how to analyze data effectively!
In essence, probability distributions help businesses understand and predict patterns in data. This knowledge is invaluable for making strategic decisions that drive success.
Regression Analysis
Simple Linear Regression
Regression is like a crystal ball for businesses. It helps forecast future outcomes based on historical data. In simpler terms, regression shows the relationship between two variables. It’s particularly significant in business forecasting, allowing companies to predict sales or costs with a sprinkle of math magic.
Imagine a company spending $1,000 on advertising. They notice that each dollar spent results in an extra $10 in sales. Using simple linear regression, they can create a formula: Sales = 10 * Advertising Spend. This equation allows them to predict how much revenue they’ll generate with varying ad budgets. If they decide to spend $2,000, they can confidently expect to rake in $20,000 in sales. This predictive power is invaluable for budgeting and strategic planning.

Looking to enhance your understanding of regression analysis? Grab a copy of Business Statistics: A First Course. It’s a fantastic resource for understanding statistical concepts!
Multiple Regression
Multiple regression takes things up a notch. Instead of just two variables, it analyzes the relationships among several. For example, a business might want to know how advertising spend, pricing, and competitor actions affect sales. Here, multiple regression works like a seasoned detective, piecing together clues from various sources.
However, it’s crucial to watch out for multicollinearity. This occurs when two or more independent variables are highly correlated, leading to misleading results. Imagine trying to figure out which of your overly friendly friends is responsible for your latest social media success. If both are equally charming, it’s tough to pinpoint who deserves the credit!
Model evaluation is essential in this context. Businesses need to assess the regression model’s effectiveness using metrics like R-squared values or p-values. These metrics help determine if the model accurately represents the relationships among variables. A solid multiple regression model not only boosts understanding but also aids in making sound business decisions.

Time-Series Analysis
Time-series data is like a diary for businesses, documenting changes over time. This type of data tracks a variable, such as sales or profits, at consistent intervals. Understanding time-series data is crucial for identifying trends and making informed forecasts.
Businesses often analyze time-series data to spot patterns. For example, a retail store may notice that sales spike every December, thanks to holiday shopping. By recognizing this seasonal trend, they can prepare by stocking up on inventory.
Methods for analyzing trends involve calculating moving averages or employing exponential smoothing. These techniques help smooth out fluctuations and highlight underlying patterns. Seasonal decomposition, on the other hand, focuses on dissecting seasonal effects from the data. By understanding the rhythm of sales throughout the year, businesses can optimize their strategies and increase profits.

Tools for Business Statistics
Software and Applications
When it comes to business statistics, having the right tools is like having a trusty toolbox. Several popular statistical software packages help businesses analyze data effectively. Let’s take a look at a few heavyweights in the field.
Excel is the Swiss Army knife of data analysis. It’s user-friendly, widely accessible, and packed with functions that can handle everything from basic calculations to complex statistical analyses. With Excel, businesses can create graphs and charts that turn numbers into visual stories. For a comprehensive guide on using Excel for descriptive statistics, check out this article on descriptive statistics in Excel.

Excel is an essential tool for data analysis in business. Learn more about descriptive statistics in Excel here.
R is another gem in the toolbox. This open-source software is designed for statistical computing and graphics. It’s favored by data scientists due to its flexibility and vast array of packages for various analyses. Companies can use R to perform high-level statistical modeling and even machine learning tasks.
SPSS (Statistical Package for the Social Sciences) is popular among researchers and social scientists. It provides a comprehensive suite of tools for data management and statistical analysis. With SPSS, users can conduct sophisticated analyses without needing extensive programming knowledge. If you’re using SPSS on a Mac, check out our guide on macOS IBM SPSS Statistics fix 28.1.1.
SPSS is a powerful tool for statistical analysis. Find out more about troubleshooting SPSS on macOS here.
Tableau takes data visualization to the next level. It transforms raw data into interactive dashboards. This allows businesses to present their findings compellingly and understandably. With Tableau, users can drag and drop data elements to create stunning visual representations that highlight key insights. If you’re just starting out, check out Tableau 2021 for Beginners. It’s a great resource to kickstart your journey!
These tools streamline data analysis and visualization, making it easier for businesses to glean actionable insights from their data. Whether you’re crunching numbers in Excel or creating beautiful visualizations in Tableau, the right software can elevate your statistical game.

Importance of Data Visualization
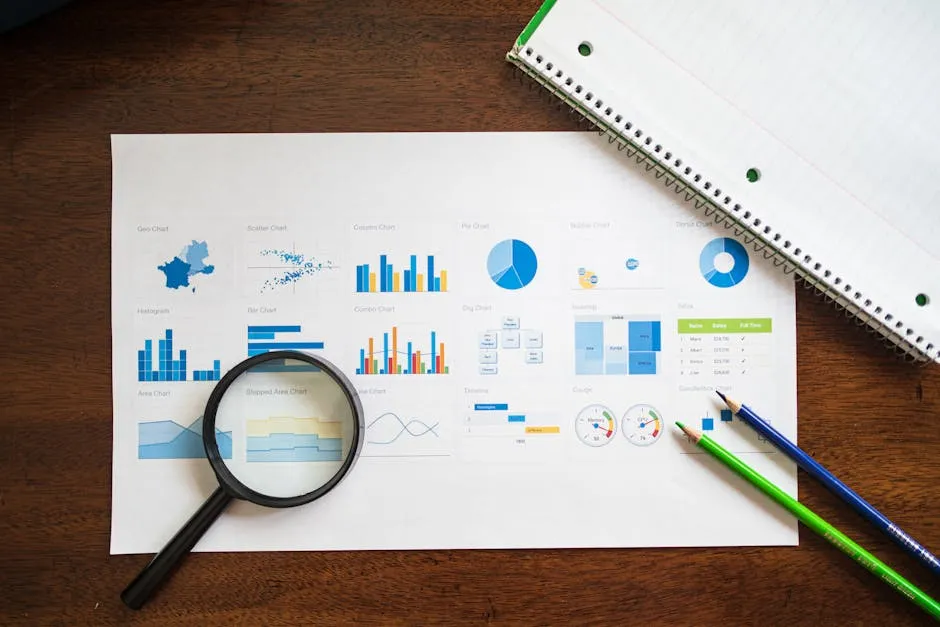
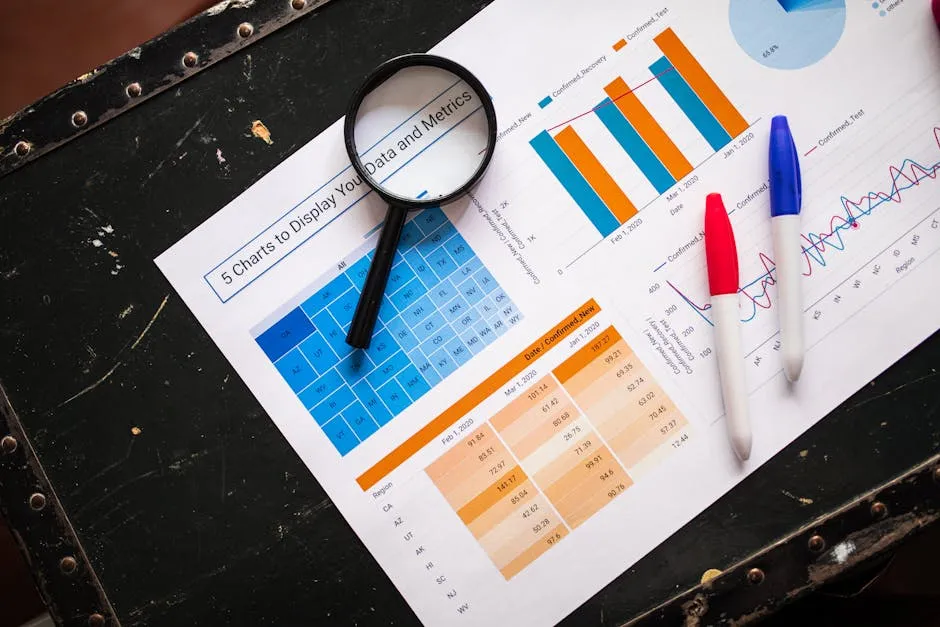
Data visualization is like a superhero for business statistics. It transforms complex numbers into visuals that make sense. Charts, graphs, and dashboards play key roles in interpreting statistical data. They help businesses see trends and patterns quickly, turning data into actionable insights.
For example, a pie chart can show market share, making it easy to see who’s winning. A line graph might illustrate sales trends over time, revealing seasonal peaks and valleys. Dashboards can consolidate multiple data sources into one view, giving a real-time snapshot of performance.
Effective data visualization techniques include heat maps and scatter plots. Heat maps are great for showing density or concentration of data points. Imagine a map showing customer locations; darker areas indicate where most customers reside, guiding marketing efforts.
Scatter plots, on the other hand, illustrate relationships between two variables. For instance, plotting advertising spend against sales can reveal how effective marketing is. Are you spending more and seeing higher sales? Or is it time to rethink your strategy?
While you’re at it, consider investing in The Visual Display of Quantitative Information. This book is a fantastic resource for mastering data visualization!
The ultimate goal of data visualization is clarity. It should simplify complex information and make it accessible. When done right, these visuals spark curiosity and drive informed decisions, making them a must-have in every business toolkit.
In a nutshell, data visualization not only enhances comprehension but also fuels strategic thinking. So, the next time you find yourself staring at a spreadsheet, remember: a well-crafted visual could be the key to unlocking valuable insights!

Conclusion
Understanding basic business statistics is crucial for effective decision-making. Throughout this article, we’ve explored the significance of statistics in various business functions. From market research to quality control, statistics provide the backbone for informed choices.
We discussed essential concepts like populations and samples, the difference between descriptive and inferential statistics, and various applications of statistics in businesses. Each topic highlighted how data-driven insights can enhance operational efficiency and profitability.
Moreover, we emphasized the importance of tools like regression analysis and time-series forecasting. These techniques help businesses predict trends and optimize strategies. By grasping these concepts, professionals can make smarter, evidence-based decisions.
If you’re looking for a practical guide to implementing these concepts, consider reading Lean Analytics: Use Data to Build a Better Startup Faster. It’s a great read for any aspiring entrepreneur!
In today’s fast-paced and competitive environment, a solid understanding of basic business statistics is not just beneficial; it’s essential. As you navigate your career, consider exploring further learning resources or courses in business statistics. Books, online platforms, and interactive courses can deepen your knowledge and sharpen your analytical skills.
Investing time into understanding statistics today can lead to better decision-making tomorrow. Let data guide your choices and elevate your business acumen to new heights!
FAQs
What is the difference between descriptive and inferential statistics?
Descriptive statistics summarize data, providing insights like averages and percentages. Inferential statistics allow us to make predictions about a population based on a sample. Think of descriptive statistics as a snapshot, while inferential statistics are more like a crystal ball!
How can I apply business statistics in my job?
You can apply business statistics in various roles. For example, as a marketer, analyze customer data to target campaigns effectively. In finance, use statistics to forecast trends and assess risks. The key is to leverage statistical insights to make informed decisions that drive success.
What software tools are best for learning business statistics?
Some great software tools include Excel for basic analysis, R for advanced statistical modeling, and Tableau for data visualization. Each tool has its strengths, so choose one that aligns with your learning goals and needs.
What resources are available for further learning?
Consider books like “Basic Business Statistics” by Berenson et al., and online courses on platforms like Coursera or Udemy. Websites like Khan Academy also offer free resources to deepen your understanding of business statistics.
Please let us know what you think about our content by leaving a comment down below!
Thank you for reading till here 🙂
All images from Pexels


