Introduction
In a world where we often take our vision for granted, the simple eye chart has become an unsung hero in the realm of eye care. You might think of it as just a series of letters on a wall, but it’s so much more—it’s a crucial tool in diagnosing visual acuity and identifying potential vision problems. Eye charts help us see how well we can spot that tiny text on menus or distinguish between the charming face of a friend and a random shrub.
From the iconic Snellen chart to modern digital alternatives, eye charts boast a rich history and a significant role in maintaining our visual health. These handy tools have evolved over time, adapting to the needs of both professionals and everyday folks. Did you know that Heinrich Küchler created the first eye chart in 1835, featuring images of decreasing size? Fast forward to today, and we have various types of eye charts that cater to different testing situations.
This article will cover everything you need to know about eye charts. We’ll tackle their uses, types, history, and even show you how to conduct a simple vision test at home. Spoiler alert: you might want to grab your glasses (or not) because we’re diving into the fascinating world of visual acuity testing.
Whether you’re curious about how eye charts work or looking to test your vision from the comfort of your home, we’ve got you covered. So, let’s get started and discover the magic of eye charts—your gateway to better vision! After all, who wouldn’t want to see the world as clearly as possible?

The Anatomy of an Eye Chart
What is an Eye Chart?
An eye chart is a specialized tool designed to measure visual acuity. It typically features rows of letters, symbols, or shapes in various sizes. The primary purpose of an eye chart is to assess how well a person can see at a distance. This simple yet effective tool plays a vital role in vision testing, allowing healthcare professionals to identify potential vision problems.
Understanding visual acuity is crucial. It’s not just about knowing if you can read the fine print on your favorite novel. It helps determine how clearly you can see everyday objects, like road signs or your friend’s face across a crowded café. Essentially, eye charts help ensure that your sight is sharp enough for life’s many adventures.

Types of Eye Charts
Snellen Chart
The Snellen chart is the superstar of eye charts. It’s the one most people picture when they think of an eye exam. This chart features letters of decreasing size, typically arranged in rows. Patients read from the top down, indicating the smallest line they can decipher. Commonly used in clinics and schools, the Snellen chart is a staple in vision testing. You can get your own Snellen Eye Chart to test your vision at home!
LogMAR Chart
Next up is the LogMAR chart. It’s the hipster cousin of the Snellen chart. Used primarily in clinical settings, this chart features letters in a more standardized format. Each line holds the same number of letters, and it provides a more accurate assessment of visual acuity. It’s particularly useful for research and detailed evaluations, making it a favorite among eye care professionals. If you’re looking to upgrade your vision testing, consider a LogMAR Eye Chart for precise measurements!
E Chart and Lea Symbols
For the youngest vision testers, we have the E chart and Lea symbols. The E chart features a giant letter “E” that can be turned in various directions. Kids simply point to the direction the “E” is facing. The Lea symbols, on the other hand, use simple shapes like a house, apple, or square, making it perfect for preschoolers. These charts ensure that children can participate in vision screening without feeling overwhelmed. You can learn more about the E Chart for Kids to make vision testing fun!
Understanding the E chart and its application in pediatric vision testing is essential for effective eye care. blood pressure chart
Rosenbaum and Jaeger Charts
Now, let’s not forget about near vision testing. The Rosenbaum and Jaeger charts focus on that. These charts are designed to test how well you see up close. They typically feature smaller print, often used for reading tasks. If you’ve ever squinted at a menu, you might appreciate the importance of these charts. You can have your own Rosenbaum Pocket Vision Test Chart for your reading needs!
Other Variants
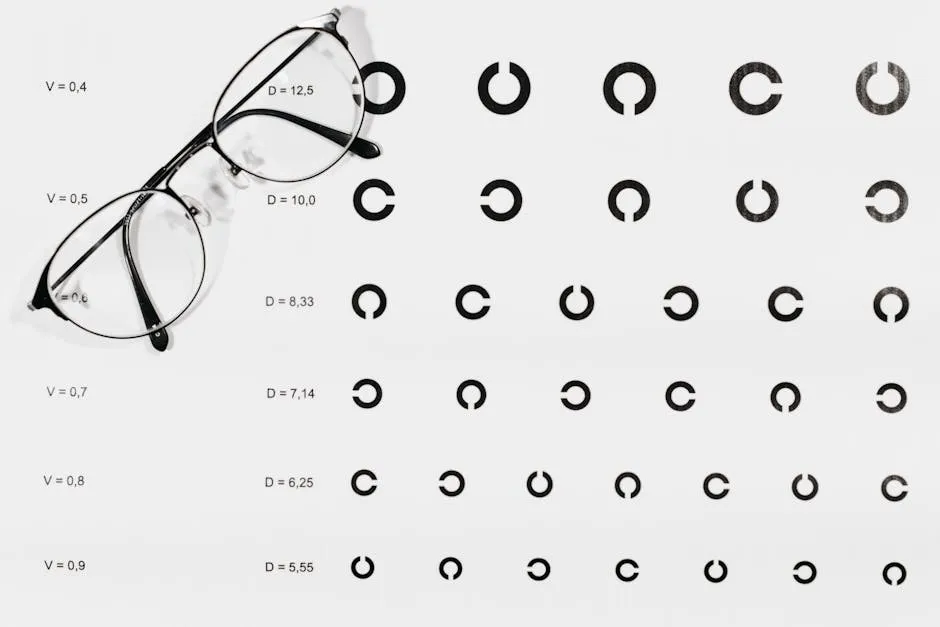
Finally, we have other variants like the Landolt C and Golovin-Sivtsev tables. The Landolt C chart features a ring with a gap that patients must identify, while the Golovin-Sivtsev is a Russian variant using letters of decreasing size. These charts serve specialized purposes and are often employed in specific medical contexts. If you’re interested in exploring different testing options, check out the Landolt C Vision Test Chart!
In summary, each type of eye chart has its unique role in the vision testing ecosystem. By utilizing a variety of charts, eye care professionals can more accurately assess and monitor visual acuity across different age groups and conditions. Whether you’re a child pointing at an “E” or an adult tackling the fine print of a contract, eye charts are essential tools in the journey toward clearer vision.

The History of Eye Charts
Early Beginnings
Vision testing has roots that stretch back to the 13th century. In those days, the idea of measuring eyesight was as common as finding a decent cup of coffee today. Early pioneers recognized that some folks struggled to see clearly, but standardized methods were non-existent. Instead, rudimentary tests involved simple observations and guesswork. The lack of formal charts left many in the dark—literally!
Fast forward to the 19th century, and the scene began to change. With the rise of the scientific method, eye care professionals started to seek more reliable ways to assess vision. The groundwork laid by earlier scholars set the stage for the eye charts we know and love today.

Key Milestones
The 19th century marked a turning point in vision testing. In 1835, Heinrich Küchler created the first eye chart, featuring images that decreased in size. This chart was a game changer, offering a structured approach to testing visual acuity. Not long after, in 1843, Küchler introduced an alphabetic chart, making it even easier to assess eyesight. But the real star of the show arrived in 1862, when Herman Snellen unveiled his iconic chart.
Snellen’s chart became the gold standard, revolutionizing how we measure vision. It featured rows of letters, each line smaller than the last. Eye care professionals could now determine how well someone could see at a distance, which helped diagnose various vision impairments.
As the demand for vision testing grew, schools began adopting standardized vision screenings. By 1899, it was common for children to undergo eye exams to catch issues early. This proactive approach ensured that kids could see the blackboard clearly, preventing future academic struggles. The evolution of eye charts didn’t just help individuals; it sparked a cultural shift in how we prioritize vision health.

The Science Behind Eye Charts
Understanding Visual Acuity
Visual acuity is a measure of how clearly one can see. It often gets expressed as a fraction, such as 20/20. The numerator indicates the testing distance—20 feet in this case—while the denominator shows the distance at which a person with normal vision could read the same line. For example, 20/40 means you can see at 20 feet what a person with normal vision can see at 40 feet.
This measurement helps determine how well individuals can perform daily tasks, from reading street signs to spotting the ice cream truck. Eye charts play a vital role in this assessment, offering a straightforward way to gauge visual clarity.

Optotype Crowding
Ever tried reading a crowded menu? It can be a challenge! This phenomenon is known as optotype crowding. When letters or symbols are too close together, it becomes harder to identify them. Research shows that if characters are closer than 4.4 bar widths apart, visual acuity takes a hit.
This factor is crucial during testing. If an eye chart fails to account for crowding, results may not accurately reflect a person’s true vision capabilities. Thus, proper spacing on eye charts matters for reliable assessments. To avoid crowding and enhance your reading experience, consider using an Adjustable Reading Stand!

Innovations and Alternatives
The tech world has embraced eye charts, leading to exciting innovations. Digital eye charts have emerged, offering interactive ways to test vision. These high-resolution displays can adapt to user settings, enhancing accuracy. Some applications even calibrate based on viewing distance, minimizing examiner bias.
While traditional eye charts remain widely used, digital alternatives provide flexibility and precision. Whether you’re in an office or at home, these tools can help you keep tabs on your vision health. So, if you haven’t upgraded your vision testing gear yet, now’s the time! You might want to check out a Digital Eye Chart for a modern touch!

When to Seek Professional Help
Signs of Vision Problems
Noticing changes in your vision? Don’t ignore them! Here are some common signs that suggest it’s time to schedule an eye exam.
First, if you struggle to read street signs, even the big ones, it’s a red flag. Blurriness or having to squint all the time? That’s your eyes sending a clear message. If you find yourself frequently experiencing headaches, especially after reading or using screens, your vision might be the culprit.
Another sign is if you see double. Yes, that can be a bit alarming! You might also notice that colors seem dull or faded. This could indicate underlying issues. If you find yourself having trouble seeing at night, called night blindness, it’s time to consult a professional.
Lastly, if you’ve experienced sudden flashes of light or floaters, don’t wait. These could hint at serious conditions that need immediate attention. Remember, your eyes communicate a lot. Listening to them can lead to timely intervention and prevent further complications.

Importance of Regular Eye Exams
Now, let’s talk about why regular eye exams are essential. You might think, “I can see just fine!” But eye exams go beyond the simple “Which line can you read?” test. They help detect issues that you might not notice until it’s too late.
During a comprehensive exam, professionals assess not just your vision, but the overall health of your eyes. They check for conditions like glaucoma, cataracts, and even signs of diabetes. Early detection can make all the difference in treatment options.
Moreover, regular exams can help track changes in your vision over time. This continuous monitoring allows for adjustments in your prescription or timely referrals to specialists.
And let’s not forget the fun part! Optometrists often have the latest technology, making eye exams a fascinating experience. From fancy machines to colorful charts, it’s like a mini adventure for your eyes. So, don’t skip out on those appointments—your eyes will thank you!

Conclusion
In conclusion, eye charts serve as a vital resource for understanding and monitoring our visual health. Knowing how to use them properly can empower individuals to take proactive steps in maintaining their eyesight. Whether you’re using a traditional chart or a modern digital alternative, regular vision checks can make a significant difference in quality of life. So, the next time you glance at an eye chart, remember—it’s not just a series of letters; it’s your window to the world.

FAQs
What is the purpose of an eye chart?
Eye charts are essential tools for measuring visual acuity. They help determine how well a person can see at a distance. By identifying letters or symbols of varying sizes, individuals and eye care professionals can assess vision clarity. This simple yet effective method aids in diagnosing potential vision problems. So, whether you’re squinting at a street sign or trying to read a menu, an eye chart can help clarify how well you see.
How often should I check my vision with an eye chart?
Regular vision checks are vital! Ideally, you should test your vision at least once a year. This frequency helps catch any changes early on. If you wear glasses or contact lenses, you might want to check more often. Even if you feel your vision is fine, it’s smart to keep tabs on it. Significant changes can sneak up on you, and early detection can prevent more serious issues later.
Can I perform an eye test at home?
Absolutely! Testing your vision at home can be both fun and informative. You can easily print a free eye chart, available online, and follow simple instructions to assess your eyesight. Just make sure to hang the chart at eye level in a well-lit room, and measure the correct distance away—typically 10 feet. Remember, this home test is not a substitute for a professional evaluation. If you notice any concerning results, schedule an appointment with your eye doctor.
What does 20/20 vision mean?
Ah, the legendary 20/20 vision! This term refers to normal visual acuity. When someone says they have 20/20 vision, it means they can see clearly at 20 feet what should normally be seen at that distance. However, this doesn’t mean perfect vision. Some people may have better vision, like 20/15, while others may struggle with 20/40 or worse. The numbers indicate how well you see compared to the average person, so keep that in mind next time you brag about your sharp eyesight!
Are there any limitations to using an eye chart for vision testing?
Yes, eye charts have their limitations. While they are fantastic for assessing visual acuity, they don’t diagnose eye diseases like glaucoma or cataracts. They also may not account for issues like peripheral vision loss or depth perception problems. Moreover, testing conditions can affect results. Things like lighting, distance, and even anxiety can play a role. So, while eye charts are a helpful tool, they should be part of a more comprehensive eye examination conducted by a professional. Remember, your eyes deserve the best care!
Please let us know what you think about our content by leaving a comment down below!
Thank you for reading till here 🙂
All images from Pexels


