Introduction
Elk hunting in Colorado is more than just a sport; it’s a cherished tradition that brings families and friends together in the great outdoors. With breathtaking landscapes and a thriving elk population, Colorado has become a premier destination for hunters seeking the thrill of the chase. But let’s be real: hunting isn’t just about the fun; it’s also about strategy and preparation.
To be successful, understanding elk hunting statistics is crucial. These stats help hunters make informed decisions, improve their planning, and ultimately increase their chances of success in the field. From draw odds to success rates, every piece of data plays a role in shaping a hunter’s strategy.
In this section, we’ll cover key statistics vital for elk hunters. We’ll discuss draw odds that reveal how likely you are to secure a coveted tag, success rates that indicate how many hunters actually bring home an elk, and harvest numbers that showcase the overall health of the elk population. Additionally, we’ll explore population trends that inform hunters about the shifts in elk herds across the state. With this knowledge, you’ll be better equipped to navigate the challenges of elk hunting and enhance your overall experience.

Understanding Colorado Elk Hunting Statistics
When we talk about elk hunting statistics, we’re referring to a treasure trove of data. These include everything from the number of licenses available to the total elk harvested each season. Understanding these statistics is invaluable for any serious hunter.
First and foremost, draw odds are the bread and butter of elk hunting statistics. They tell you how many hunters applied for each license and how many actually got one, allowing you to strategize your approach for future hunts. Next, success rates give insight into how many hunters successfully harvested an elk—an essential measure of effectiveness in various management units.
Harvest numbers provide an overview of the elk population’s health and how many animals are taken each year. This data is crucial for understanding if a particular area is overhunted or if the elk population is thriving. Lastly, population trends indicate shifts in herd sizes, which can be influenced by environmental factors, hunting pressure, and wildlife management practices.
For hunters, these statistics are not just numbers; they form the backbone of planning and strategy. By analyzing trends, understanding odds, and evaluating success rates, you can make more informed decisions about where and when to hunt. This knowledge can be the difference between an unsuccessful outing and a trophy on your wall.
Understanding elk hunting statistics is vital for any serious hunter in Colorado. These statistics offer insights that can shape your hunting strategy and improve your odds of success. Learn more about Colorado elk hunting statistics.
The Role of Colorado Parks and Wildlife (CPW)
Colorado Parks and Wildlife (CPW) plays a significant role in managing the state’s elk populations and providing hunters with access to vital statistics. As the primary agency overseeing wildlife management, CPW collects and analyzes data on elk herds, hunting licenses, and harvest metrics. Their efforts ensure that hunting remains sustainable and that elk populations thrive.
Hunters can easily access a wealth of statistics through the CPW website. The site offers detailed reports on draw odds, success rates, harvest numbers, and population estimates. These resources are invaluable for anyone looking to improve their hunting strategy.
By staying informed through CPW, hunters can adapt to changing conditions and make more strategic decisions. Whether you’re a seasoned pro or a novice just starting, understanding the role of CPW and utilizing their data will enhance your elk hunting experience in Colorado.
Elk Hunting Draw Statistics
Draw Recap Reports
Draw Recap Reports are crucial resources for elk hunters in Colorado. They provide a comprehensive summary of draw results, including both pre-draw and post-draw data. Understanding these reports is essential for planning future hunts. They reveal how many licenses were available, how many hunters applied, and the success rates for obtaining those coveted tags.
Recent years have seen a fluctuation in the number of licenses and applications. For instance, in 2024, the number of licenses available was slightly lower than in previous years due to changing wildlife management policies. The 2023 report indicated a total of 25,000 licenses were available, with about 90,000 applications submitted. That’s a lot of hopeful hunters vying for a limited number of tags!
Success rates vary from year to year, affected by factors such as weather conditions and hunting regulations. In 2020, the draw success rate was around 25%, while by 2024, it dipped to approximately 22%. This decrease can be attributed to an increase in applicants and a stable number of licenses issued. Analyzing these trends helps hunters determine their chances and make informed decisions about where to apply in the future.

Speaking of preparation, having the right Hunting Backpack is crucial for carrying all your gear. A good backpack not only holds your essentials but also ensures comfort during those long treks through the wilderness. Trust me; your back will thank you!
Drawn Out Reports
Drawn Out Reports provide valuable insight into the last point or choice at which a license was drawn for specific hunt codes. They’re like the final chapter of a suspenseful book—revealing critical details about the draw process. This information is vital for understanding the dynamics of the application process. For example, if you know that a particular unit saw licenses drawn at a higher preference point level, you can adjust your strategy accordingly.
Analyzing Drawn Out Reports from the past few years reveals interesting trends. In 2023, many hunters found that units with high demand required significantly more preference points compared to previous years. This shift suggests increased competition, possibly due to rising interest in elk hunting. Understanding how these trends shift can help you craft a more effective application strategy.
Secondary Draw Recap Reports
Secondary Draw Recap Reports serve a distinct purpose in the elk hunting landscape. They provide insights into the secondary draw process, which occurs after the primary draw. This is a golden opportunity for those who didn’t secure licenses in the initial round. These reports summarize available licenses, the number of applicants, and the success rates for the secondary draw.
Key findings from the last few years indicate that while primary draws are highly competitive, secondary draws can offer a second chance for hopeful hunters. For instance, in 2022, approximately 5,000 licenses were available in the secondary draw, with a success rate of about 15%. Although lower than primary draws, these odds can be a lifeline for those who missed out initially. The data from these reports emphasize the importance of staying informed and being ready for the secondary draw, as it can significantly enhance your elk hunting chances.
And while you’re preparing for your next hunt, consider picking up a Elk Hunting Guidebook to enhance your skills and knowledge. It’s like having a mentor in your pocket, guiding you through the ins and outs of elk hunting!

Elk Harvest Statistics
Annual Harvest Reports
Colorado elk hunting statistics reveal fascinating trends in elk harvest over the years. According to the Colorado Parks and Wildlife (CPW), the total elk harvested in 2023 reached approximately 39,800 elk. This number reflects a slight decrease from 2022, where hunters harvested around 41,200 elk.
When we look back at the past five years, the harvest numbers show some interesting fluctuations. In 2019, the total number was 42,500 elk, which marked a peak in recent years. By 2020, the harvest dropped to 38,000, and in 2021, it rebounded to about 40,000 elk. The consistency in these figures indicates a stable elk population, although variations occur due to weather, hunting conditions, and overall hunting pressure.
From 2019 to 2023, here’s how the harvest numbers compare:
- 2019: 42,500 elk
- 2020: 38,000 elk
- 2021: 40,000 elk
- 2022: 41,200 elk
- 2023: 39,800 elk
These statistics help hunters gauge the effectiveness of their hunting strategies and understand the health of the elk population in Colorado. With the data available, hunters can make informed decisions about where to hunt based on historical harvest success.
Hunter Success Rates
Hunter success rates in Colorado vary significantly based on the method of hunting employed. Over the past few years, average success rates for elk hunting have hovered around 18%. This percentage represents the number of hunters who successfully harvested an elk during the season.
Breaking this down by method, archery hunters report a notably higher success rate compared to their rifle and muzzleloader counterparts. For example, archery hunters had a success rate of approximately 22%, while rifle hunters’ success was around 17%, and muzzleloader hunters trailed slightly at 15%.
Several factors influence these success rates. The selection of hunting units plays a crucial role; areas with lower hunting pressure often yield better results. Additionally, environmental conditions such as weather, habitat health, and elk movement patterns significantly affect the chances of a successful harvest.
Hunters who scout their chosen units beforehand, stay updated on elk movements, and adapt to changing conditions tend to see better results. With this knowledge, hunters can increase their odds and enjoy a more rewarding experience in the field. The combination of historical data and firsthand accounts from fellow hunters creates a treasure trove of information to improve future hunts.

And while you’re at it, don’t forget to pack a reliable Tactical Knife. Whether it’s for processing game or just whittling a stick, a good knife is an essential tool for any hunter!
Elk Population Estimates
Population Trends Over Time
In 2023, the elk population in Colorado was estimated at around 280,000 animals, a stable figure compared to previous years. This population size is crucial for maintaining healthy ecosystems and supporting sustainable hunting practices. The Colorado Parks and Wildlife (CPW) regularly monitors elk populations to assess their health and make necessary management decisions.
Population estimates over the last five years have shown minor fluctuations, reflecting the influence of various factors. For instance, in 2019, the population was estimated at 290,000, while numbers dipped slightly to 275,000 in 2020, likely due to high hunting pressure and challenging weather conditions. However, the population rebounded to approximately 280,000 in 2023, indicating resilience and effective management.
Key factors affecting elk populations include habitat conditions, hunting pressure, and environmental changes. The introduction of wolves into certain areas has sparked debates about their impact on elk numbers. In general, wolves can increase natural selection and lead to healthier herds but may also cause short-term population declines.
CPW’s ongoing research into elk health and habitat is critical for ensuring the sustainability of the population. By understanding these dynamics, hunters can adapt their strategies to ensure successful and responsible hunts. With a stable elk population, Colorado continues to be a prime destination for elk hunting enthusiasts seeking adventure and connection with nature.
Impact of External Factors
Elk populations are not just affected by the natural environment; external factors play a huge role too. Weather patterns significantly influence their survival rates. For instance, extreme winter conditions can lead to higher mortality, particularly among young elk. During harsh winters, food becomes scarce as snow covers low-elevation ranges, making it difficult for elk to access necessary forage.
Human activities also impact elk populations. Urban development and recreational activities, such as hiking and mountain biking, disrupt their natural habitats. This increased human presence can cause elk to alter their migration patterns, reducing their access to food and shelter.
Moreover, the recent reintroduction of wolves has sparked discussions about its potential effects on elk herds. While wolves can help control elk numbers, leading to healthier populations, initial impacts may include a decline in elk numbers. Historical evidence from states like Idaho and Montana indicates that wolf predation can significantly affect elk populations in the short term. However, these effects often stabilize over time, as elk adapt to their new predator dynamics.
In summary, both environmental conditions and human activities are crucial in shaping elk populations in Colorado. Hunters must stay informed about these factors to increase their chances of a successful hunt while contributing to sustainable wildlife management. Understanding the intricate balance between elk, their habitats, and external influences can make all the difference in this thrilling pursuit.
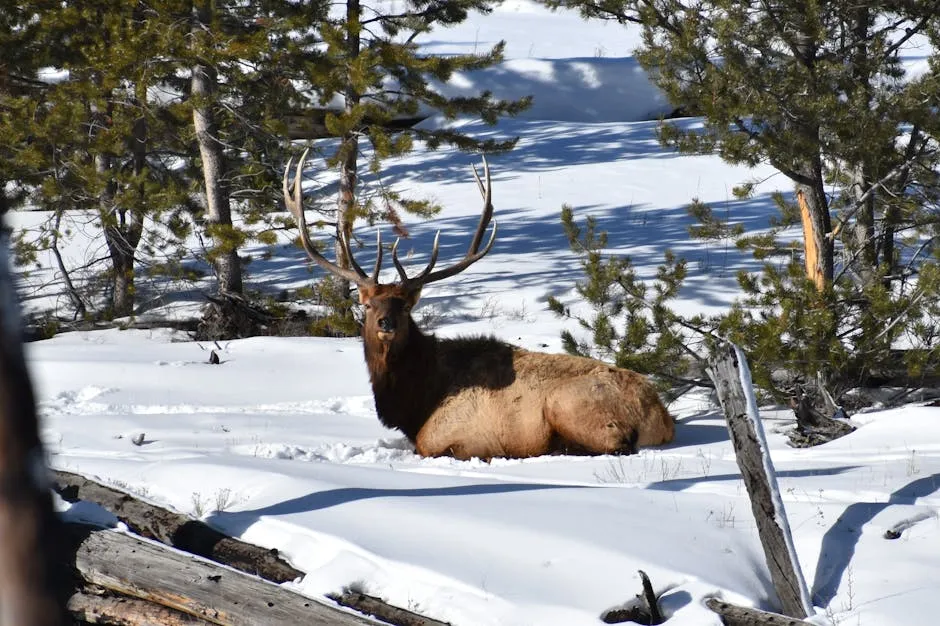
Tips for Hunters Based on Elk Hunting Statistics
Choosing the Right Game Management Unit (GMU)
Selecting the right Game Management Unit (GMU) is crucial for elk hunting success. Colorado boasts numerous GMUs, each with its unique characteristics. Historical success rates and harvest data are your best friends in making this decision.
Start by examining the harvest statistics for each unit. Look for areas where a significant number of elk have been harvested. Ideally, you want to select a GMU that has reported at least 80 to 100 elk harvested each year. This indicates a healthy elk population and better odds for hunters.
But don’t stop there. Scouting is key! If you can, visit the GMU before the season starts. Familiarize yourself with the terrain, access points, and where elk are likely to move. Local knowledge is invaluable. Chat with other hunters or local guides who know the area well. They can provide insights into where elk have been spotted and the best times to hunt.
Another important factor is hunter density. A unit with fewer hunters can significantly increase your chances of success. If you notice a particular GMU has high hunter density but low success rates, it might be worth looking elsewhere.
Finally, consider the elevation and habitat types in the GMU. Elk tend to inhabit areas with abundant cover and food sources. Look for units that provide a mix of forested areas and open meadows. These habitats are ideal for elk, especially during the rut.
By combining statistical data with local insights and thorough scouting, you can make an informed choice about which GMU to hunt. This strategic approach will set you up for a rewarding elk hunting experience.
Understanding License Draw Odds
License draw odds can seem like a puzzling maze for new hunters, but understanding them is essential for your success. These odds tell you how likely you are to draw a license for a specific GMU. They are influenced by the number of applicants and the number of available licenses.
The first step in interpreting draw odds is to familiarize yourself with the preference point system. This system rewards hunters with points for each unsuccessful application. Accumulating points increases your chances in subsequent draws. New hunters should focus on building their points by applying for units with lower competition and better draw odds.
When checking draw odds, pay attention to both resident and non-resident statistics. Non-residents often face stiffer competition in popular units, so aim for units where the odds are more favorable.
Additionally, consider the timing of your application. Some units have a reputation for high draw success rates during specific years. Keeping an eye on these trends can help you strategize your application timing effectively.
Once you’ve successfully drawn a license, it’s time to plan your hunt! Utilize the data from your chosen GMU to decide when and where to hunt.

By understanding draw odds and effectively accumulating preference points, new hunters can significantly improve their chances of securing a license.
Conclusion
Understanding elk hunting statistics is vital for any serious hunter in Colorado. These statistics offer insights that can shape your hunting strategy and improve your odds of success. By choosing the right GMU based on historical harvest data and understanding license draw odds, hunters can make informed decisions that enhance their hunting experience.
Remember, knowledge is power. Utilize the data available through Colorado Parks and Wildlife and stay connected with local hunting communities. By doing so, you’ll not only increase your chances of a successful hunt but also become a more informed and responsible hunter. So gear up, stay informed, and get ready for an unforgettable elk hunting season!
Please let us know what you think about our content by leaving a comment down below!
Thank you for reading till here 🙂
And for those camping trips, don’t forget to bring along a Portable Campfire. Perfect for roasting marshmallows or keeping warm after a long day of hunting!
Lastly, hydrate smartly with an Insulated Water Bottle. It keeps your drinks cold or hot for hours, and trust me, when you’re out in the wild, hydration is key!
All images from Pexels

