
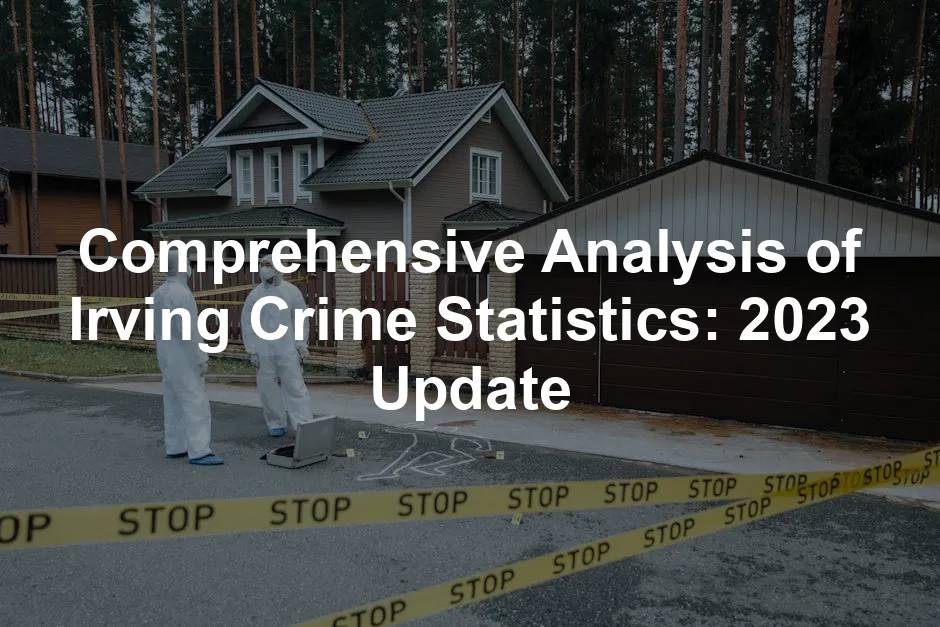
Introduction
Irving, Texas, is a vibrant city nestled in the heart of the Dallas-Fort Worth metroplex. Home to around 241,000 residents, Irving boasts a diverse community and a rich cultural landscape. This city is not just known for its proximity to major business centers but also for its growing attractions, such as the Irving Arts Center and the bustling Las Colinas area. As a significant hub in the region, understanding the safety dynamics of Irving becomes essential for its residents and visitors alike.
The purpose of this article is to provide a thorough analysis of crime statistics in Irving, equipping current residents and potential movers with valuable insights into safety concerns. With crime rates being a crucial factor in assessing a location’s livability, having access to detailed statistics will aid in making informed decisions.
Understanding crime statistics is vital for establishing a sense of security in any community. Residents can gauge the safety of their neighborhoods and take necessary precautions. Moreover, potential movers can evaluate whether Irving aligns with their safety expectations. With crime data continuously evolving, it’s imperative to stay updated on trends that may impact the community. Thus, this analysis will offer clarity and context to the current crime landscape in Irving, Texas.

To enhance your home security in Irving, consider investing in a Home Security Camera System. These systems not only provide peace of mind but also help you keep an eye on your property when you’re away. With advanced features like motion detection and remote access, it’s like having a personal security guard without the hefty salary!
Understanding Crime Statistics
What Are Crime Statistics?
Crime statistics are numerical representations of crime occurrences within a specific area over a defined time frame. These figures are compiled by law enforcement agencies, which record reported incidents and categorize them into various crime types. The data provides a snapshot of crime trends and helps authorities identify patterns.
The primary sources of crime data include local police departments and the FBI’s Uniform Crime Reporting (UCR) program. The UCR aggregates crime reports from thousands of law enforcement agencies nationwide, providing a comprehensive overview of crime rates across different jurisdictions. This systematic approach allows for a reliable comparison of crime statistics among cities, states, and the nation as a whole.
Types of Crimes
Crime can generally be classified into two main categories: violent crimes and property crimes.
Violent Crimes involve force or the threat of force. Typical examples include murder, rape, robbery, and assault. These offenses are often prioritized in law enforcement due to their severe impact on victims and communities.
Property Crimes, on the other hand, focus on the unlawful taking or destruction of someone else’s property. Common examples include burglary, theft, and motor vehicle theft. While property crimes may not involve direct confrontation, they still significantly affect community safety and the overall quality of life for residents.
By understanding these categories, residents can better navigate safety issues and engage with their community regarding crime prevention efforts. To bolster your personal safety, consider a Personal Safety Alarm. These handy gadgets can emit a loud sound to deter attackers and alert others in case of an emergency.

Current Crime Statistics in Irving
Overview of Crime Rates
Irving, Texas, showcases a crime rate that exceeds national averages. The overall crime rate stands at 29 crimes per 1,000 residents, which might raise an eyebrow or two. In comparison, the national average is a less alarming 23.5 per 1,000 residents. When looking at the violent crime rate, Irving boasts about 3.35 violent crimes per 1,000 residents, while the national average hovers around 4.0. However, property crime in Irving hits a staggering 25.32 per 1,000 residents, significantly above the national average of 20.
So, what does that mean for you? Simply put, if you’re living in Irving, there’s a 1 in 35 chance of being a victim of crime. Comparatively, this risk is lower than some larger cities but still presents a noteworthy concern for residents. In relation to Texas cities, Irving’s crime rate surpasses 88% of other locales. Yet, it’s important to note that when compared to communities of similar size, Irving is statistically safer than most.
Yearly trends in crime rates reveal a mix of ups and downs. Recent data indicates an overall increase in crime by approximately 8.7% year-over-year. This uptick is primarily driven by property crimes, which have surged by about 9.1%. Violent crime, on the other hand, has escalated by 5.7%. In the past five years, violent crime rates have shown fluctuations but have generally increased, marking a rising concern for residents.

Breakdown of Violent Crime
Diving deeper into the details of violent crime, we find some eye-opening statistics. In Irving, the total number of violent crimes reported is 853, which translates to a rate of 3.35 per 1,000 residents. Here’s how the violent crime breakdown looks:
- Murder: 12 incidents, or 0.05 per 1,000 residents.
- Rape: A concerning figure of 144, resulting in a rate of 0.57 per 1,000 residents.
- Robbery: 164 incidents, equating to 0.64 per 1,000 residents.
- Assault: A hefty 534 assaults, which comes to 2.10 per 1,000 residents.
To put Irving’s violent crime statistics into perspective, let’s compare them with both Texas and national averages. The state of Texas has a higher rate of violent crime, averaging around 4.76 per 1,000 residents. Nationally, the average stands at 4 per 1,000 residents. This indicates that while Irving has its challenges, it is relatively safer in the violent crime category compared to broader Texas statistics.
In summary, while Irving has a few concerning figures in violent crime, they remain below the state average and just slightly under national levels. The city’s commitment to safety and community engagement plays a crucial role in addressing these issues head-on. Residents are encouraged to stay vigilant while enjoying the diverse and vibrant city life that Irving offers.

Breakdown of Property Crime
Property crime in Irving presents a significant concern for residents, with rates that surpass both state and national averages. Let’s unpack the detailed statistics to get a clearer picture.
Burglary: In Irving, there were 749 reported burglaries, translating to a rate of approximately 2.94 incidents per 1,000 residents. This figure indicates that property owners should be particularly vigilant, as a burglary can leave both emotional and financial scars. To further protect your home, consider a Smart Door Lock. With features like keyless entry and remote locking, it adds a layer of convenience and security to your home.
Theft: The most prevalent property crime in Irving is theft. A whopping 4,712 incidents were reported, equating to a staggering 18.50 per 1,000 residents. It’s essential to consider this when deciding how to safeguard your belongings. Keep your valuables close and your door locked!
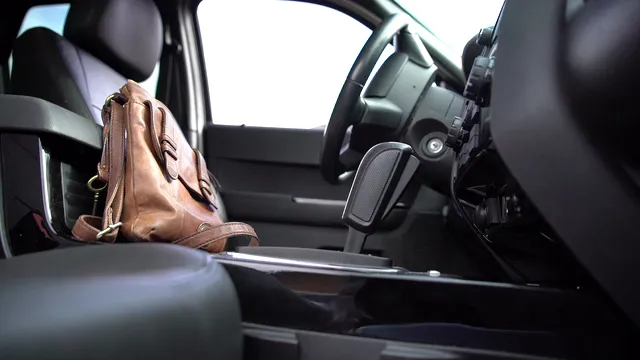
Motor Vehicle Theft: The number of motor vehicle thefts in Irving stands at 988, resulting in a rate of about 3.88 per 1,000 residents. This is a pressing issue, as it highlights the need for residents to employ extra precautions, such as parking in well-lit areas and using Car Steering Wheel Lock. These devices are a simple yet effective way to deter thieves.
When comparing Irving’s property crime rates to Texas and national figures, the picture becomes even more telling. Irving’s property crime rate is 25.32 per 1,000 residents, significantly higher than the Texas average of 28.68 and the national average of 20 per 1,000 residents. This discrepancy indicates that while Irving is not the most dangerous city, it still has its share of challenges.
Despite these numbers, Irving is not entirely devoid of safety. When adjusted for population size, it ranks more favorably than many other cities of similar size. For instance, while residents have a 1 in 39 chance of becoming a victim of property crime, those odds are still better than in some neighboring cities.
Understanding these statistics is crucial for residents and potential movers. Awareness can empower individuals and communities to take necessary actions to enhance safety and reduce property crime. With the right precautions and community engagement, Irving can work towards lowering these rates and fostering a safer environment for all. Consider keeping an Emergency First Aid Kit handy for any unexpected situations.
Crime Risk Comparison: Irving vs. Nearby Cities
Comparison with Neighboring Cities
When we stack Irving against nearby cities like Arlington, Coppell, and Dallas, the differences in crime statistics become quite apparent. Irving’s overall crime rate sits at 29 crimes per 1,000 residents, significantly higher than Arlington’s 24 and Coppell’s mere 14. In contrast, Dallas exhibits a crime rate of 45 per 1,000 residents, leaving Irving in a relatively safer spot compared to its larger neighbor.
Looking at violent crime specifically, Irving reports 3.35 incidents per 1,000 residents, which is lower than Dallas’s 4.76 but higher than Coppell’s 1.98. This paints a picture of Irving as a mid-tier option for safety among these cities.

The property crime rate adds another layer to this comparison. Irving’s rate of 25.32 per 1,000 residents may alarm some, especially when compared to Coppell’s 12.45. However, it’s essential to recognize the population density and urban dynamics at play. Higher population density often correlates with elevated crime rates, as evidenced by Dallas’s numbers.
Factors influencing these disparities can include socioeconomic conditions, community policing effectiveness, and resident engagement levels. Areas with active community initiatives and better resources often fare better in terms of safety. In addition, consider adding a Neighborhood Watch Sign to your property to promote safety awareness and community vigilance.
Neighborhood Safety Ratings
In Irving, not all neighborhoods share the same safety profile. Some areas shine with higher safety ratings, offering residents a more secure living environment.
Neighborhoods like Hemingway Court and La Villita Townhome Association boast lower crime rates. These communities often benefit from active neighborhood watch programs, community events, and engaged residents who prioritize safety.

Las Colinas West also ranks as a safer area. Its well-planned infrastructure and community resources contribute to a sense of security. Riverside Village and Valley Ranch Association North are other noteworthy mentions, where residents report feeling secure while walking at night.
The common thread among these neighborhoods is a strong sense of community. Residents frequently collaborate with local law enforcement, fostering a partnership that helps keep crime rates low. With continued vigilance and community involvement, these neighborhoods can maintain their safety ratings and serve as models for others in Irving.
In summary, while Irving’s overall crime statistics may seem concerning, there are pockets of safety that reflect the community’s dedication to maintaining a secure environment. To further enhance your home security, think about installing an Outdoor Security Camera to monitor your property effectively.

FAQs
What is the overall crime rate in Irving compared to other Texas cities?
Irving’s crime rate is higher than 88% of Texas cities. It stands at 29 crimes per 1,000 residents, notably above the national average of 23.5. While Irving is not the most dangerous city, it does have its challenges.
Is Irving a safe place to live?
Safety perceptions vary among residents. Around 52% feel ‘pretty safe,’ while 34% feel ‘very safe.’ These sentiments reflect a mix of community concerns and commendations for law enforcement visibility. The overall crime rate suggests that while there are risks, many neighborhoods offer a sense of security.
What resources are available for residents to report crime?
Residents can report crimes to the Irving Police Department through their website or by calling local law enforcement. Additionally, neighborhood watch programs and community forums offer platforms for residents to discuss safety issues and collaborate with police in crime prevention efforts.
How do crime rates in Irving compare historically?
Recent data indicates an 8.7% increase in crime year-over-year. However, the violent crime rate has fluctuated over the past five years. While there have been increases in property crimes, the overall trend shows that many categories have seen periods of decline, demonstrating the city’s ongoing efforts to improve safety.
Please let us know what you think about our content by leaving a comment down below!
Thank you for reading till here 🙂 Don’t forget to check out the essentials like a Fire Extinguisher and a LED Flashlight for your safety!
For a detailed look at the crime statistics in Arlington, you can check out this resource: arlington tx crime statistics.
All images from Pexels


