
Introduction
AP Statistics is a pivotal course for high school students. It equips them with essential skills in data analysis, probability, and interpretation, preparing them for college-level statistics. This course isn’t just a box to check; it opens doors to understanding the world through data. Whether it’s analyzing survey results or making informed decisions based on statistical evidence, AP Statistics lays the groundwork.
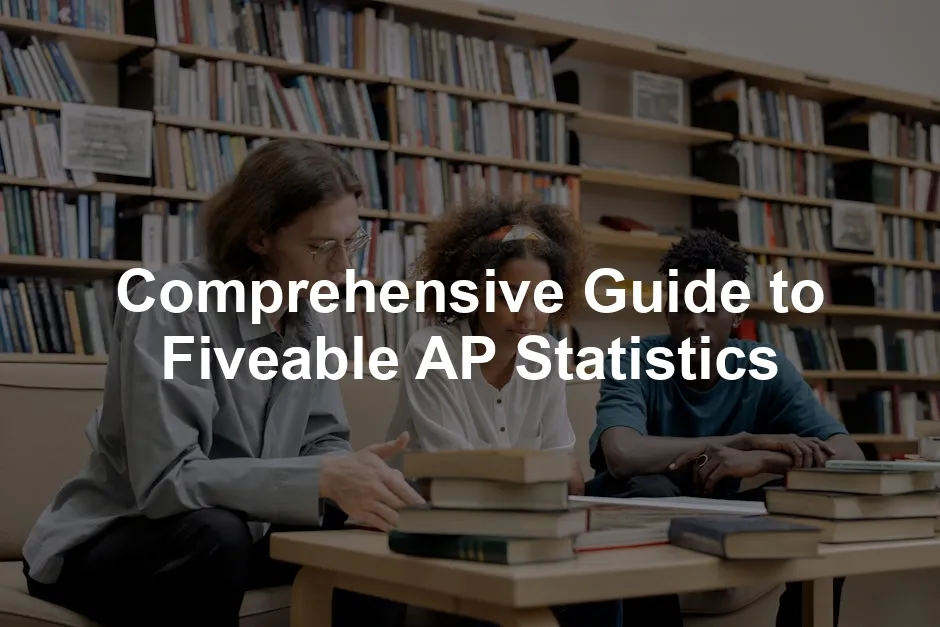
Fiveable emerges as a beacon for students navigating this challenging subject. Offering interactive resources, study guides, and a vibrant community, it transforms the intimidating world of statistics into an engaging learning experience. Students can access live sessions, practice materials, and supportive peers, making exam preparation a team effort rather than a solitary struggle.
In this blog post, we’ll dive into the significance of AP Statistics, explore Fiveable’s unique offerings, and provide insights into how students can maximize their study time. We’ll also discuss the course content and study tools available on Fiveable to ensure every student is ready to ace their exam. And if you want to brush up on your basics, consider picking up the Probability and Statistics for Dummies. It’s like having a statistician in your pocket!

Section 1: Overview of AP Statistics
What is AP Statistics?
AP Statistics is an advanced placement course that introduces students to the fundamental concepts of statistics. It covers a variety of topics, including data collection, analysis, and interpretation. This course is part of the College Board’s AP curriculum, allowing students to earn college credit while still in high school.
The significance of AP Statistics extends beyond the classroom. Colleges increasingly value students who have a strong background in data literacy. Understanding statistics is crucial in today’s data-driven society. It not only enhances critical thinking but also improves college admissions prospects, as universities seek students who can analyze and interpret data effectively. For more insights on data analysis, check out this tips for effective data analysis in economics and statistics.

Why Choose Fiveable for AP Statistics?
Fiveable sets itself apart with its interactive study tools and resources specifically designed for AP Statistics. Students can access comprehensive study guides that break down complex topics into digestible sections. The platform also offers practice quizzes that allow students to test their knowledge and identify areas for improvement.
Community support is another fantastic feature of Fiveable. Students can connect with peers facing similar challenges, share resources, and motivate each other to stay on track. User testimonials reveal an impressive track record of success. Many students credit Fiveable with helping them achieve high scores on their AP exams. And to make your study sessions even more effective, grab a Statistics Cheat Sheet Poster to have key formulas at your fingertips!
In summary, Fiveable is a valuable resource for mastering AP Statistics. With its engaging tools, community support, and proven results, it’s an excellent choice for students aiming for success in this important subject.

Section 2: Course Content Breakdown
Unit 1: Exploring One-Variable Data
Key Concepts and Topics
One-variable data focuses on a single variable’s characteristics. This type of data can be categorized in various ways, including categorical and quantitative types. Categorical data includes distinct groups, like colors or types of fruit, while quantitative data consists of numerical values, such as test scores or heights.
Students will learn to represent one-variable data through different techniques. For categorical data, tables and bar graphs are common tools. Think of bar graphs as the life of the party, showcasing categories in vibrant colors. On the other hand, quantitative data often uses histograms and box plots. Histograms provide a way to visualize how data distributes across ranges.
Measures of central tendency are crucial for summarizing data. The mean, median, and mode each serve unique purposes. The mean, or average, is the go-to for many. The median, the middle value, shines when dealing with skewed data. Meanwhile, the mode reveals the most frequently occurring value, making it a handy tool for understanding trends.
Variability measures, including range, variance, and standard deviation, help assess data spread. The range is the simplest, showing the difference between the highest and lowest values. Variance and standard deviation provide deeper insights into how much data varies from the mean. Understanding these concepts equips students to analyze data effectively. To dive deeper into data analysis, consider picking up a Statistical Data Analysis Book.
In summary, Unit 1 lays a solid foundation for understanding one-variable data. By mastering these techniques, students enhance their analytical skills, preparing them for more complex statistical analysis.

Unit 2: Exploring Two-Variable Data
Key Concepts and Topics
Unit 2 shifts focus to two-variable data, exploring the relationship between pairs of variables. This unit introduces correlation and regression analysis, vital tools in statistics. Correlation assesses how strongly two variables relate. For example, does studying more lead to higher test scores? The correlation coefficient quantifies this relationship, ranging from -1 to 1. A value close to 1 indicates a strong positive relationship, while a value near -1 suggests a strong negative relationship.
Graphical representations play a crucial role in understanding relationships. Scatter plots are a favorite for visualizing two-variable data. Each point represents a data pair, revealing potential trends. Observing patterns in scatter plots helps students grasp how variables interact.
Regression analysis takes it a step further. It allows students to create equations that predict one variable based on another. Linear regression, the most common type, finds the best-fitting line through data points. This line can then predict outcomes, making it a powerful statistical tool. If you’re looking for a good reference, a Study Guide for AP Statistics can be incredibly helpful!
Students will also learn about residuals—the differences between observed and predicted values. Analyzing these residuals helps assess the goodness of fit for their models. Understanding how to interpret and analyze these relationships prepares students for real-world applications of statistics.
In essence, Unit 2 equips students with essential skills to analyze and interpret relationships between two variables. By mastering correlation and regression, students can make informed predictions and insights based on data.

Unit 3: Collecting Data
Key Concepts and Topics
Unit 3 centers on the critical phase of data collection. Understanding how to gather data effectively is essential for accurate analysis. This unit highlights various sampling methods, experimental designs, and data collection techniques.
Sampling methods are crucial for obtaining representative data. Simple random sampling ensures each member of a population has an equal chance of selection. Stratified sampling divides the population into subgroups, ensuring representation across key characteristics. Convenience sampling, while easier, can lead to biased results. It’s essential for students to grasp these methods to avoid pitfalls in their studies.
Experimental design is another key focus. A well-structured experiment allows researchers to draw valid conclusions. This includes identifying control and experimental groups, randomization, and blinding. Students will learn to create experiments that minimize bias and maximize reliability. If you want to keep your notes organized, a Graph Paper Notebook might just be your new best friend!
Data collection techniques vary depending on the research context. Surveys, interviews, and observations each have strengths and weaknesses. Surveys can gather large amounts of data quickly, but poorly worded questions can skew results. Interviews provide depth but can be time-consuming. Observational methods can yield rich insights, yet they may introduce subjectivity.
In summary, Unit 3 is essential for students to understand the foundations of data collection. Mastering these techniques will enable them to gather reliable data for future analysis, improving their overall statistical literacy.

Unit 4: Probability, Random Variables, and Probability Distributions
Key Concepts and Topics
Probability is the spice of statistics! It helps us quantify uncertainty and make informed predictions. At its core, probability measures how likely an event is to occur. Think of it as your crystal ball for data-driven decisions!
In statistics, probability has various applications. For example, it helps in risk assessment, quality control, and even sports predictions. Imagine betting on your favorite team; knowing their chances of winning can make all the difference!
Random variables are another key player in this unit. They are numerical outcomes of random phenomena. You can think of them as the quirky characters in a statistical sitcom, each with its own personality. There are two main types of random variables: discrete and continuous. Discrete variables take on specific values, like the number of students in a class. Continuous variables, however, can take any value within a range, like the height of all students in that class.
Next up, we have probability distributions. They provide a framework for understanding the behavior of random variables. Each distribution describes the likelihood of different outcomes. For instance, the binomial distribution deals with scenarios involving success or failure, like flipping a coin. On the other hand, the normal distribution is the bell curve we all know and love. It describes many natural phenomena, from heights to test scores.
Understanding these concepts helps students become statistical wizards. They learn to calculate probabilities, interpret distributions, and make predictions based on data. With these tools, they can tackle real-life problems, from predicting election outcomes to assessing product quality. If you’re looking for a good way to visualize your data, check out the Data Visualization Toolkit!
In summary, Unit 4 lays the groundwork for understanding the role of probability, random variables, and distributions in statistics. It’s where the magic begins, turning uncertainty into insightful predictions.

Unit 5: Sampling Distributions
Key Concepts and Topics
Sampling distributions might sound like a mouthful, but they play a crucial role in statistics. They help us understand how sample statistics relate to the entire population. Picture this: if you want to know the average height of all high school students, measuring just a few won’t cut it. Enter the sampling distribution!
A sampling distribution is the distribution of a statistic (like the mean) calculated from multiple samples. The beauty here is that it can reveal insights about the population without surveying everyone. It’s like having your cake and eating it too!
The Central Limit Theorem (CLT) is the star of this show. It states that as the sample size increases, the sampling distribution of the sample mean approaches a normal distribution, regardless of the population’s distribution. This means that even if your population has a skewed distribution, your sample means will tend to cluster around the true population mean. It’s like magic, but with numbers! To learn more about this concept, check out the central limit theorem is important in statistics because.
Understanding CLT allows students to make inferences about populations based on sample data. It’s fundamental for hypothesis testing and constructing confidence intervals. Students learn how to determine whether observed differences in sample means are statistically significant. A small p-value usually indicates that the observed difference isn’t due to random chance.
In essence, Unit 5 empowers students to make educated guesses about populations. By mastering the concept of sampling distributions and the Central Limit Theorem, they become equipped to tackle real-world statistical challenges. Whether it’s conducting surveys or interpreting data, this knowledge is indispensable.

Unit 6: Proportions
Key Concepts and Topics
Proportions are everywhere, and they hold the key to understanding categorical data! In statistics, a proportion represents the fraction of a whole. For example, if 30 out of 100 students prefer pizza over burgers, the proportion of pizza lovers is 0.30. Simple, right?
This unit focuses on two main concepts: confidence intervals and hypothesis testing for proportions. Confidence intervals provide a range of values likely to contain the true population proportion. It’s like saying, “I’m 95% sure that between 25% and 35% of students prefer pizza.” This gives a more nuanced view than just stating a single value.
Creating confidence intervals involves calculating the standard error and using the critical value from the z-table. This might sound complex, but it’s just a mathematical way to say, “I have a good idea where the true proportion lies.”
Hypothesis testing comes next. This process determines whether there’s enough evidence to support a specific claim about a population proportion. For instance, if a school claims that more than 50% of students prefer pizza, a hypothesis test can help confirm or refute that claim. Students learn to set up null and alternative hypotheses, calculate p-values, and make decisions based on statistical evidence.
In summary, Unit 6 arms students with the tools to analyze proportions effectively. By mastering confidence intervals and hypothesis testing, they can make informed decisions about categorical data. This knowledge is crucial in various fields, including market research and public health.

Unit 7: Means
Key Concepts and Topics
When it comes to statistics, means are like the popular kids at school—they get a lot of attention! This unit delves into confidence intervals and hypothesis testing specifically for means.
A mean is simply the average of a set of values. It’s calculated by adding all values and dividing by the count. However, estimating the true population mean based on a sample is where things get interesting!
Confidence intervals for means work similarly to those for proportions. They provide a range where the true mean is likely to fall. To construct a confidence interval for the mean, students must calculate the sample mean and standard deviation. By using the t-distribution for small samples, they ensure accuracy. It’s like casting a wide net to catch the elusive true mean!
Hypothesis testing for means follows suit. It assesses whether the sample mean provides enough evidence to support a claim about the population mean. Students learn to formulate null and alternative hypotheses, calculate t-scores, and determine p-values. If the p-value is low, it suggests that the observed sample mean is significantly different from the hypothesized population mean.
In summary, Unit 7 equips students to navigate the world of means. By mastering confidence intervals and hypothesis testing, they learn to make informed conclusions about population averages. This skill is vital for interpreting data in various real-world contexts, from educational assessments to scientific research. To keep your study materials organized, consider a Desk Organizer for Study Materials.

Unit 8: Chi-Squares
Key Concepts and Topics
Chi-square tests are powerful tools in statistical analysis. They help determine if there’s a significant association between categorical variables. Think of it as a party where categories mingle. Are they dancing together or standing awkwardly in corners?
The most common chi-square test is the goodness-of-fit test. This test checks if observed data match expected frequencies. For example, if you expect 25% of students to prefer pizza, but only 15% do, something’s fishy! A chi-square test helps identify if that difference is statistically significant or just a fluke.
Another important chi-square test is for independence. This one examines whether two categorical variables are related. Picture a survey about favorite ice cream flavors across different age groups. A chi-square test can reveal if age influences flavor preference. If kids love chocolate while adults lean towards vanilla, that’s a relationship worth noting!
To conduct a chi-square test, you calculate the expected frequencies based on your hypothesis. Then, you compare observed frequencies against these expectations. The formula for the chi-square statistic is straightforward: it involves summing the squared differences between observed and expected values, divided by the expected values.
Interpreting results is crucial. A high chi-square value suggests a strong association, while a low value indicates independence. Typically, p-values help determine significance. A p-value less than 0.05 often signals a significant relationship. However, always consider context. Statistical significance doesn’t imply practical significance.
In summary, chi-square tests are invaluable for analyzing categorical data. They provide insights into relationships and patterns that might otherwise go unnoticed, making them essential for any budding statistician. And if you want to keep your study sessions focused, grab a pair of Noise-Cancelling Headphones!
Unit 9: Slopes
Key Concepts and Topics
Regression analysis is a cornerstone of statistical modeling. It helps us understand relationships between variables, particularly when predicting outcomes. The slope of a regression line is particularly important. It tells us how much we can expect the dependent variable to change when the independent variable increases by one unit.
Imagine you’re studying how study hours affect exam scores. The slope of your regression line reveals the average increase in exam scores for each additional hour studied. If the slope is 5, each hour of study raises the score by 5 points. Sounds like a sweet deal, right?
Interpreting the slope requires context. A positive slope indicates a direct relationship. As one variable increases, so does the other. A negative slope, however, reveals an inverse relationship. More study hours could lead to burnout, causing scores to drop. It’s all about balance!
Confidence intervals for the slope provide a range of plausible values. A narrow interval indicates precision in your estimate. If the interval includes zero, the relationship might not be significant. Hence, it’s a red flag that we might be chasing ghosts!
Setting up a hypothesis test for the slope involves formulating a null hypothesis, typically stating that the slope is zero. If you find a low p-value, it suggests a significant relationship. But don’t forget to check for other factors that might be influencing your results.
In essence, understanding slopes in regression analysis is crucial for making predictions based on data. It equips students with the skills to interpret relationships effectively, guiding decision-making in various fields. Whether it’s economics, education, or health, regression analysis provides valuable insights. And if you need a little inspiration while studying, consider hanging up some Inspirational Wall Art!
Section 4: Exam Strategies and Tips
Multiple Choice Questions (MCQ) Strategies
The AP Statistics exam’s multiple-choice section can feel like a whirlwind! Here are some savvy tips to help you navigate through the sea of options and avoid common traps.
First, read each question carefully. Don’t rush! Take a moment to understand what’s being asked. Often, students misinterpret questions, leading to unnecessary mistakes.
Next, eliminate obviously incorrect choices. This strategy narrows down your options and boosts your chances of guessing correctly if needed. If you can confidently rule out two answers, your odds of picking the right one skyrocket!
When faced with questions involving calculations, jot down the necessary steps on your scratch paper. This not only organizes your thoughts but also helps you avoid careless errors.
Another classic pitfall is overthinking. Remember, the simplest option is often the correct one. If a choice seems overly complex, it might be a distraction. Trust your instincts!
Lastly, manage your time wisely. Each question is worth the same, so don’t dwell too long on any single item. If you’re stuck, mark it and move on. You can always return later if time permits. And while you’re at it, make sure to stay hydrated with a Water Bottle for Hydration!

Free Response Questions (FRQ) Strategies
Free response questions can seem daunting, but with the right strategies, you can tackle them like a pro! Here’s how to manage your time and structure your responses effectively.
First, read all parts of the question thoroughly. Ensure you understand what is being asked before diving into calculations. Pay attention to keywords like “explain,” “describe,” or “calculate.” These clues guide your response.
Time management is crucial. Allocate a specific amount of time to each question based on its complexity. For instance, if a question has multiple parts, be prepared to spend a little more time on it.
When structuring your answers, clarity is key. Start with a brief introduction that outlines your approach. Follow up with calculations, and remember to label your work. Make it easy for the grader to follow your logic!
Don’t forget to include units in your answers, especially in calculations. Forgetting them can lead to losing valuable points. At the end of your response, summarize your findings concisely. A clear conclusion reinforces your argument and captures the essence of your analysis.
Lastly, practice makes perfect! Familiarize yourself with past FRQs and practice writing out responses. This builds confidence and hones your skills. And if you need a little brain fuel, don’t forget to stock up on Study Snacks Variety Pack!

FAQs
How do I self-study AP Statistics using Fiveable?
Start by creating a study schedule. Break down units and allocate time for each. Use Fiveable’s study guides and interactive tools to reinforce your understanding. Complement your studies with practice quizzes to assess your knowledge.
What are the best resources for AP Statistics?
Fiveable stands out with its comprehensive study guides, practice quizzes, and live sessions. Additionally, consider textbooks like “The Practice of Statistics” and online platforms like Khan Academy for extra practice and explanations.
Is AP Statistics hard?
Like any AP course, it can be challenging. However, with consistent study and practice, many students find it manageable. Focus on understanding concepts rather than memorizing formulas, and you’ll likely find success.
How can I get a 5 in AP Statistics?
Start early, use quality study materials, and practice regularly. Join study groups to discuss concepts and tackle difficult problems together. Finally, take several practice exams to familiarize yourself with the test format.
What is bias in statistics?
Bias refers to systematic errors in data collection or analysis that lead to inaccurate results. Understanding bias is crucial because it can significantly affect conclusions drawn from data, making awareness and mitigation essential skills in statistics.
Please let us know what you think about our content by leaving a comment down below!
Thank you for reading till here 🙂
All images from Pexels


