

Introduction
Tempe, Arizona, is more than just a college town. It’s a vibrant city that’s home to about 191,607 residents. Nestled in the heart of the Valley of the Sun, Tempe boasts a lively atmosphere, thanks to Arizona State University. With its picturesque parks, bustling downtown, and scenic lakes, it’s a place many call home. However, like any urban area, Tempe faces its fair share of crime.
Understanding crime statistics is crucial for evaluating community safety. These numbers provide a lens through which residents, potential movers, and city officials can assess the security of the neighborhoods they inhabit or seek to join. For residents, knowing crime trends can inform decisions about personal safety. Potential movers often rely on these statistics to gauge whether Tempe is the right fit for their lifestyles. City officials use the data to craft policies that enhance public safety and community well-being.
In this article, we’ll break down crime statistics in Tempe, AZ. We will cover the total crime rate, provide a breakdown of violent and property crimes, and explore recent trends that have emerged in the past few years. Let’s dive into the numbers to see what they reveal about safety in this dynamic city.

Understanding Crime in Tempe, AZ
Overview of Crime Rates
Tempe’s total crime rate is a staggering 112% higher than the national average. This alarming figure prompts concern among both residents and officials. Breaking it down further, the violent crime rate stands at 58% above the national average, while property crimes soar to a shocking 122% higher.
Examining these statistics reveals the types of crimes that affect daily life. Violent crimes include murder, rape, robbery, and assault, while property crimes encompass burglary, theft, and vehicle theft. In Tempe, the violent crime rate is 584 incidents per 100,000 people. In comparison, the national average is only 432. The property crime rate in Tempe is even more disconcerting at 4,334 per 100,000 residents, compared to the national figure of 1,954.
These statistics are not just numbers; they represent the safety concerns of residents and the challenges faced by policymakers. For residents, knowing the crime landscape helps inform personal safety measures. City officials can utilize this data to develop strategies aimed at reducing crime and improving community safety. Understanding these crime rates is essential for fostering a safer environment in Tempe and ensuring that the community thrives.

And speaking of personal safety, have you considered investing in a Personal Safety Alarm Keychain? It’s a small yet powerful tool that can help alert others in case of an emergency. This handy device can give you peace of mind while navigating through the city.
Recent Trends in Crime Data
Tempe, AZ, has witnessed some notable shifts in its crime statistics recently. The total reported incidents for 2022 reached a staggering 9,221, with a population hovering around 191,607. This translates to a crime rate of 4,919 incidents per 100,000 people. That’s 112% higher than the national average!
What does this mean? Well, you might want to keep your eyes peeled when walking around downtown!
In 2022, crime rates increased by 12.1% compared to the previous year. The violent crime rate saw a slight decrease of 0.5%, while property crimes surged by 14.1%. This change is a significant topic of discussion among residents and local officials.
To visualize these trends, consider a chart that illustrates the year-over-year fluctuations in crime rates. Such graphs can help convey the gravity of the situation while making it easier to understand the patterns.
In summary, the crime situation in Tempe is evolving rapidly, and keeping track of these changes is crucial for residents seeking to stay informed about their community’s safety. If you’re looking to enhance your home security, consider investing in a Home Security System Wireless Alarm. This system can help protect your property while you rest easy at night.

Detailed Crime Breakdown
Violent Crime Statistics
Types of Violent Crimes
Violent crimes in Tempe include murder, rape, robbery, and assault. The 2022 statistics reveal the following rates per 100,000 residents:
| Crime Type | Tempe | Arizona | National |
|---|---|---|---|
| Murder | 3.7 | 6.8 | 6.3 |
| Rape | 83.2 | 44.1 | 40.0 |
| Robbery | 94.9 | 70.1 | 66.1 |
| Assault | 402.2 | 310.5 | 268.2 |
As you can see, Tempe’s murder rate is notably lower than the state average, yet the rape and robbery rates are significantly higher. This disparity raises questions about safety and the effectiveness of local law enforcement.

Yearly Trends in Violent Crimes
Looking back at historical data from 1999 to 2022, we see fluctuations in violent crime rates that reflect broader social changes.
- In 1999, the violent crime rate was about 543 incidents per 100,000 residents.
- By 2022, it had settled at 339.2, showing a decline in some areas but still above the national average.
For instance, the number of assaults peaked around 2016 at 653.9 incidents per 100,000 people, reflecting an alarming trend. However, the rate has since decreased, indicating some community efforts are paying off.
Crime trends can be confusing, but visual representations like line graphs can help illustrate the ups and downs over the years. This way, residents can better grasp how violent crimes have evolved in Tempe.
In conclusion, while Tempe’s violent crime rates exhibit a mix of concerns and improvements, knowing the types of violent crimes and their historical context is essential for residents. This understanding can help them stay vigilant and informed about their safety and the city’s ongoing efforts to combat crime.

Property Crime Statistics
Types of Property Crimes
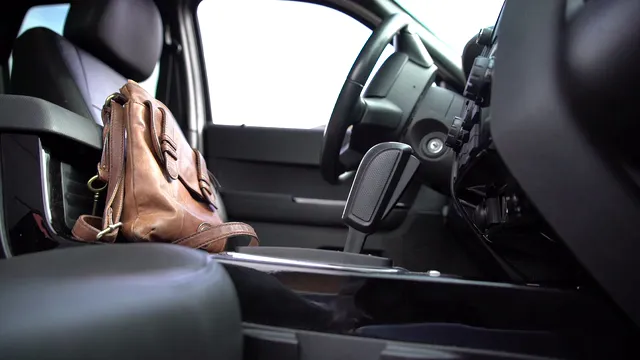
In Tempe, property crimes are a pressing concern. They consist of burglary, theft, and vehicle theft. Let’s break down the data:
- Burglary: The rate per 100,000 people is 495.5. For perspective, that’s higher than the national average of 269.8.
- Theft: Tempe’s theft rate is a staggering 3,416.5 per 100,000 residents. This figure dwarfs the national average of 1,401.9.
- Vehicle Theft: The rate here sits at 422.5, surpassing the national average of 282.7.
These statistics reveal a significant issue with property crimes in Tempe. Residents must stay vigilant, as these numbers indicate a higher risk than many other areas. A great measure to consider is a Pepper Spray for Self Defense. This compact tool can empower you to feel safer while going about your day.
Yearly Trends in Property Crimes
Property crimes in Tempe have shown an alarming upward trend. In 2022, the city experienced a 14.1% increase in property crimes compared to the previous year. This is particularly concerning for the locals. When we compare these numbers with the past few years, the pattern becomes clear.
- In 2021, property crimes were already on the rise, increasing by 8.5% from 2020.
- The previous year saw a modest decrease of 3.2%. However, the year-on-year increase reflects a growing concern for residents and local authorities.
To visualize this, imagine a graph showcasing the yearly increase: a steep incline that signifies rising fear among the community. With total reported incidents reaching a staggering 9,221 in 2022, it’s clear that property crime is a growing issue that requires attention from both residents and law enforcement. Consider enhancing your safety with a Tactical Flashlight that can illuminate dark paths and serve as a self-defense tool.

Resident Perceptions of Safety
Safety is a hot topic, especially in Tempe, AZ. A recent survey of 108 locals revealed some eye-opening perceptions. Surprisingly, only 49% of residents reported feeling safe walking at night. That’s roughly half! Meanwhile, 51% voiced concerns about crime, feeling uneasy about strolling after sunset.
These results highlight a significant gap between how residents feel and actual crime statistics. For instance, while many locals feel unsafe, crime data shows a complex picture. Tempe’s crime rate is notably higher than the national average, which raises eyebrows. Yet, it’s essential to consider that perceptions don’t always align with reality.
Many residents may feel on edge despite a slight decrease in violent crime rates by 0.5% last year. In contrast, property crimes jumped by 14.1%. The fear factor often overshadows the statistics, skewing how people view safety in their neighborhoods.
Understanding these perceptions can lead to better community engagement and safety initiatives. After all, tackling safety issues starts with acknowledging how people feel about their surroundings. For reassurance, consider using a Personal Safety Keychain that can provide a sense of security when out and about.

Factors Contributing to Crime in Tempe
Economic and Social Factors
Tempe’s crime scene isn’t just about numbers; it’s also about the economic climate. Rising living costs are putting pressure on many households. With an increase of 2.2% over the national average, financial stress is palpable. This strain often leads to higher crime rates as people struggle to make ends meet.
Housing conditions also play a significant role. Poorly maintained neighborhoods can foster criminal activity. If residents feel disconnected from their community, engagement drops, significantly impacting crime. A lack of social cohesion can create environments where crime thrives.
Community engagement is crucial. When residents actively participate in neighborhood watches or local events, they create a collective awareness. Stronger communities often lead to reduced crime rates. To help with community safety, consider a Motion Sensor Security Light that can illuminate your property at night, deterring potential trespassers.
Law Enforcement Effectiveness
Let’s talk numbers again—specifically, the police-to-resident ratio in Tempe. Currently, there are 2.84 officers per 1,000 residents. That’s below the national average of 3.25. This disparity can affect how effectively law enforcement can prevent crime.
Local law enforcement employs various strategies to keep crime at bay. Community policing efforts are at the forefront, allowing officers to build relationships with residents. When police and community members work together, it fosters trust and cooperation.
Moreover, proactive measures like neighborhood crime prevention programs can make a difference. When residents feel supported and connected to law enforcement, they’re more likely to report suspicious activities.
Overall, addressing crime in Tempe requires a multi-faceted approach. Economic stability, community engagement, and effective law enforcement are all key components in creating a safer environment for everyone. And for added security, consider a Portable Door Lock that can provide extra protection when you’re at home.
Comparisons with Nearby Cities
Crime Rate Comparisons
Understanding crime rates in Tempe, AZ, is easier when you compare them with nearby cities. Tempe’s crime rates can look ominous, but how do they stack up against neighboring areas like Phoenix, Scottsdale, and Mesa?
| City | Total Crime Rate (per 100,000) | Violent Crime Rate (per 100,000) | Property Crime Rate (per 100,000) |
|---|---|---|---|
| Tempe | 4,919 | 584 | 4,334 |
| Phoenix | 4,108 | 698 | 3,410 |
| Scottsdale | 1,345 | 233 | 1,111 |
| Mesa | 2,215 | 376 | 1,839 |
These numbers reveal a lot. Tempe’s total crime rate is startlingly high compared to Scottsdale, which boasts a much lower crime rate overall. However, when you look at Phoenix, Tempe’s total crime rate surpasses it, but the violent crime rate in Phoenix is higher. For those living in or moving to Tempe, these comparisons can help gauge safety in context.

Residents should consider these figures when evaluating their own neighborhood. Higher crime rates in Tempe may necessitate more vigilance. However, knowing that areas like Scottsdale have lower rates can provide some comfort. Don’t forget to stay prepared with an Emergency Survival Kit that can come in handy during unexpected situations.
Community Engagement in Safety
Communities across Arizona are stepping up to combat crime, and Tempe can learn from their successes. For example, Scottsdale has implemented effective neighborhood watch programs that have contributed to lower crime rates. This initiative encourages residents to look out for one another and report suspicious activities to the police.
Mesa, on the other hand, has focused on community policing, which fosters strong relationships between officers and residents. This approach has helped build trust and increased participation in crime prevention efforts.
Tempe could enhance its community engagement by creating similar programs. Here are a few suggestions for boosting community involvement:
- Neighborhood Watch Groups: Establish and promote local watch groups. Residents can work together to monitor their neighborhoods and foster safety.
- Safety Workshops: Organize workshops that teach residents about crime prevention techniques, personal safety tips, and how to report crime effectively.
- Community Events: Host events to bring residents together. A stronger sense of community can lead to increased vigilance and cooperation among neighbors.
- Collaboration with Local Law Enforcement: Encourage regular meetings between police officers and community members. Open communication can lead to better understanding and cooperation.
By learning from nearby cities and enhancing community engagement, Tempe can work towards creating a safer environment for all its residents. For those looking to stay connected, a Personal Safety Smartphone App can be a great tool to stay updated on local safety alerts.

Conclusion
In this exploration of crime statistics in Tempe, AZ, we’ve uncovered crucial insights about safety in the city. We examined how Tempe’s crime rates compare with those of nearby cities, revealing a picture of both challenges and opportunities.
Understanding these statistics is vital for residents, especially those considering moving to the area. Awareness of crime trends allows individuals to make informed decisions about their safety and engagement in the community.
Community awareness is key in addressing crime effectively. Encouraging residents to participate in safety initiatives can foster a culture of vigilance and support. After all, crime reduction is not solely the responsibility of law enforcement; it requires community involvement and proactive measures.
By staying informed about local crime statistics and actively participating in safety initiatives, residents can contribute to a safer Tempe. Together, let’s create a community where everyone feels secure and supported. And remember, a Smoke Detector with Carbon Monoxide can save lives by providing early warnings in case of emergencies!

FAQs
What are the most common types of crimes in Tempe?
Tempe experiences a variety of crimes, with property crimes, particularly theft, dominating the statistics. Violent crimes, while less frequent, include assaults and robberies.
How does Tempe’s crime rate compare to other cities in Arizona?
Tempe’s crime rate is notably higher than cities like Scottsdale and Gilbert, but it has similarities to larger cities like Phoenix.
What should residents do to stay safe in Tempe?
Residents are encouraged to stay aware of their surroundings, participate in neighborhood watch programs, and engage with local law enforcement.
Where can I find more detailed crime statistics for Tempe?
Detailed crime statistics can be found on the Tempe city website and through local law enforcement agencies. Websites like AreaVibes also provide valuable insights and comparisons.
Please let us know what you think about our content by leaving a comment down below!
Thank you for reading till here 🙂
For a comprehensive overview of crime statistics in Tempe, you can check out this detailed analysis tempe crime statistics.
All images from Pexels


