Introduction
“Statistically speaking” isn’t just a catchy phrase. It’s a beacon of logic in a sea of anecdotes. When we use this phrase, we refer to conclusions drawn from solid statistical data, leaving personal biases and stories in the dust. Statistics provide a framework for interpreting the world around us, offering insights based on evidence rather than isolated experiences.
In various fields like economics, healthcare, and social sciences, statistics play a crucial role. Imagine economists predicting market trends without numbers—yikes! That’s like trying to bake a cake without a recipe. Statistics help in making informed decisions, guiding everything from public health policies to business strategies. If you’re looking to dive deeper into the world of statistics, consider picking up “Naked Statistics: Stripping the Dread from the Data” by Charles Wheelan. This book makes statistics accessible and fun, turning complex concepts into delightful insights.
But hold your horses! While statistics are powerful, they can also be slippery. Misinterpretations can lead to misguided decisions and policy blunders. Understanding statistics empowers individuals and organizations, but it’s vital to tread carefully. A well-intentioned statistic can mislead if not understood or presented correctly.
So, what’s the takeaway here? Statistics are essential for informed decision-making, yet they demand a discerning eye. Only by grasping both the power and pitfalls of statistical analysis can we harness its true potential.

The Basics of Statistics
What is Statistics?
Statistics, at its core, is the science of collecting, analyzing, interpreting, and presenting data. It’s divided into two main branches: descriptive statistics and inferential statistics. Descriptive statistics summarize data sets, providing insights through measures like mean and standard deviation. Think of it as the movie trailer—gives you the gist without spilling all the juicy details.
On the flip side, inferential statistics allow us to make predictions or generalizations about a population based on a sample. It’s like picking a few strawberries from a patch to judge the entire harvest. This branch helps researchers and analysts draw conclusions and make predictions, lending their findings credibility.
Statistics play a pivotal role in research. They provide the tools needed to analyze trends, test hypotheses, and support findings with numbers. Without statistics, scientific inquiries would be mere guesswork, akin to throwing spaghetti at the wall to see what sticks. If you’re just starting out, “Statistics for Dummies” by Deborah J. Rumsey is a great resource! Check it out here for a friendly introduction to the world of statistics.
In summary, statistics are not just numbers; they are powerful tools that help us understand complex phenomena and make informed decisions. Embracing statistical knowledge can illuminate paths in research, business, healthcare, and beyond. So, buckle up and get ready to embrace the world of numbers!

Key Statistical Concepts
Population vs. Sample: What’s the scoop here? A population includes all subjects in a defined group. Think of it as the whole pizza. A sample, however, is just a slice—smaller and manageable. Statisticians often analyze samples to infer characteristics about the entire population. Why? Because studying every single pizza slice would take ages! The significance lies in how well the sample represents the population. A bad sample is like a slice with no cheese—nobody wants that!
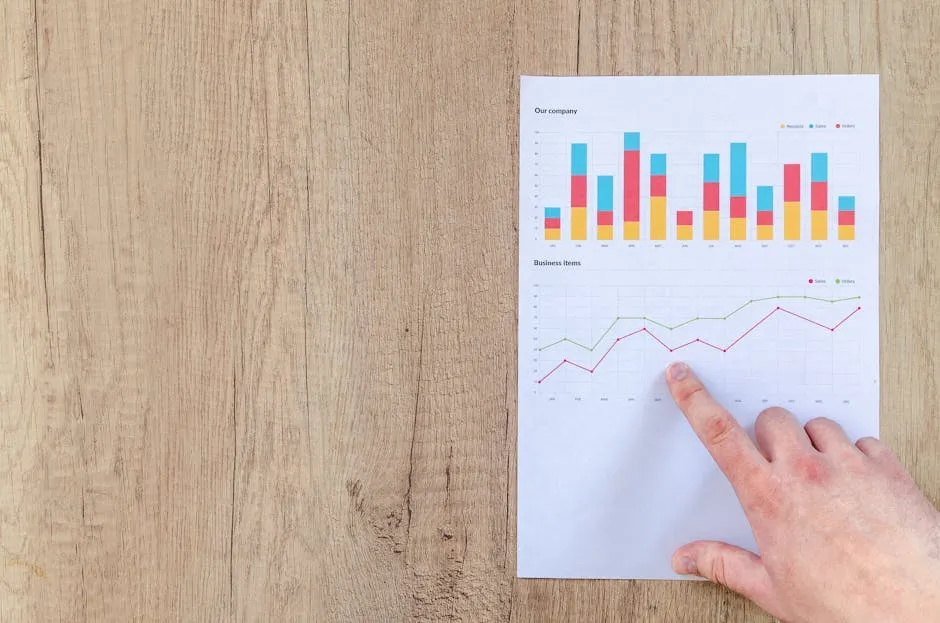
Descriptive Statistics: Descriptive statistics help summarize data. They provide a snapshot of what’s happening. Key measures include:
- Mean: The average. Add all values, then divide by the number of values.
- Median: The middle value when data is sorted. It’s great for avoiding skewed results. Statistics Poland Median Salary 2024
- Mode: The most common value. Useful when one number pops up more than others. Statsmodels Residuals Statistics
- Range: The difference between the highest and lowest values. It shows data spread.
- Variance and Standard Deviation: These tell us how data points differ from the mean. Higher values mean more variability.
Descriptive statistics are like the highlights of a movie—get the gist without all the drama! Descriptive Statistics in Manufacturing Plant
Inferential Statistics:
Inferential statistics go beyond mere description. They allow us to make predictions or test hypotheses. Key concepts include:
- Hypothesis Testing: A procedure for testing if a statement about a population is true. Statistics Hypothesis Testing Cheat Sheet
- Confidence Intervals: These give a range of values likely to contain the population parameter.
- P-values: A measure that helps determine significance. A low p-value (typically <0.05) suggests strong evidence against the null hypothesis.
Inferential statistics are like a crystal ball, revealing insights based on data patterns. The Problem with Inferential Statistics

Common Misconceptions
Statistical Significance vs. Practical Significance: Statistical significance means a result is unlikely due to chance. But practical significance asks, “Is this important in real life?” A study might show a statistically significant effect, but if it only saves a penny, who cares? Both are important. One tells you it happened, while the other tells you if it matters.
Correlation vs. Causation: Ah, the classic mix-up! Correlation means two things occur together—like ice cream sales and shark attacks in summer. But just because they happen simultaneously doesn’t mean one causes the other. Always look deeper; it’s a slippery slope to assume causation from mere correlation. Keep your eyes peeled for that elusive causal relationship!

Case Study: The Role of Statistics in Economic Predictions
Economists often rely on statistical analysis to forecast economic trends. A prime example is the use of Gross Domestic Product (GDP) growth predictions. Researchers analyze historical GDP data to identify patterns and make future projections. This statistical approach helps policymakers make informed decisions about fiscal policies and resource allocation. Case Study Statistical Study of a Company
For instance, during the 2008 financial crisis, economists employed statistical models to predict GDP recovery. Their analysis revealed that countries implementing stimulus packages experienced quicker rebounds. This case highlights how statistical predictions can shape economic strategies and drive recovery efforts during crises. If you’re intrigued by the intricacies of predictions and data, check out “The Signal and the Noise” by Nate Silver. It’s a fascinating read on how to interpret data and make predictions in an uncertain world.

Healthcare
Role of Statistics in Public Health
Statistics play a crucial role in public health. They help track disease outbreaks, evaluate the effectiveness of treatments, and shape health policies. By analyzing data, health officials can identify trends and allocate resources where they’re needed most. Healthcare Workplace Violence Statistics Virginia
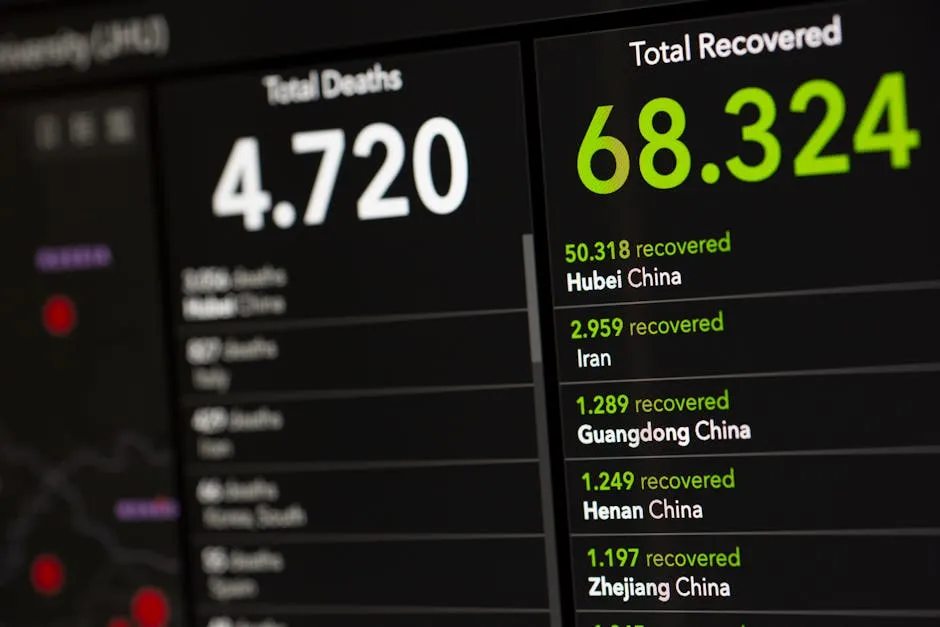
For instance, during the COVID-19 pandemic, statistics were vital. They tracked infection rates, hospitalizations, and vaccination progress. This data guided public health decisions, such as lockdown measures and vaccination campaigns. Accurate statistical analysis proved essential in navigating the health crisis effectively. If you’re interested in understanding the intricacies of public health data, consider reading “How to Lie with Statistics” by Darrell Huff. It’s a witty yet insightful take on how statistics can be misused.
Example: COVID-19 Pandemic Analysis
The COVID-19 pandemic serves as a compelling case study in the importance of statistical analysis. Throughout the pandemic, datasets were collected globally, detailing infection rates, mortality rates, and vaccination statistics.
Health organizations utilized this data to model potential spread scenarios and inform public policy. For instance, statistical analysis showed correlations between vaccination rates and reduced hospitalizations. This information helped governments justify vaccination campaigns while providing the public with clear, data-driven insights on health measures and safety protocols.

Social Sciences
Survey Methodologies
In social sciences, statistical survey methods are crucial. They help researchers gather data on public opinion, behaviors, and social trends. Different methodologies, such as random sampling and stratified sampling, ensure that collected data is representative of the population.
These methods allow sociologists and psychologists to draw meaningful conclusions from their studies. Quality surveys can illuminate societal issues and inform policy changes, making them invaluable tools in research. If you’re keen on enhancing your research skills, consider the “Statistical Methods for the Social Sciences” by Alan Agresti. It’s a comprehensive guide to statistical techniques tailored for social sciences.

Impact of Data Interpretation
The interpretation of statistical findings can significantly influence social policies. For example, a survey indicating high levels of unemployment can prompt government intervention. Conversely, misinterpretation can lead to misguided policies.
Take, for instance, a study showing a correlation between education levels and income. If policymakers interpret this data carelessly, they might implement educational reforms without addressing other contributing factors. Thus, data interpretation must be handled with care to ensure effective social policies.

Environmental Studies
Statistical Analysis in Climate Science
Climate science heavily relies on statistical analysis. Researchers use statistics to analyze climate data, such as temperature changes, sea-level rises, and greenhouse gas emissions. This analysis helps identify trends and inform environmental policies.
For example, statistical models have been crucial in predicting the impacts of climate change. These models provide insights into potential future scenarios, guiding policymakers in developing strategies for mitigation and adaptation. Proper statistical analysis is essential for creating effective environmental policies that protect our planet for future generations. If you’re passionate about environmental data, consider adding “Applied Multivariate Statistical Analysis” by Richard A. Johnson to your reading list. It’s a great resource for understanding complex environmental data.

The Ethics of Statistical Reporting
Misleading Statistics
Statistics can be a double-edged sword. They can illuminate truths or, with a flick of the wrist, create illusions. Misleading statistics often arise from cherry-picking data. Imagine a politician touting a decrease in crime rates while conveniently ignoring that violent crimes have skyrocketed. It’s like celebrating your birthday while ignoring the cake is on fire!
Misleading graphs are another sneaky tactic. A bar graph can look impressive, but if the y-axis starts at a higher number, it can exaggerate differences. Ever seen a graph that makes minor changes look monumental? It’s like playing dress-up with data. This manipulation can skew public perception, leading to misguided beliefs.
The consequences? They can be dire. In politics, misleading statistics can shape policies that affect millions. During elections, candidates often twist data to paint a rosy picture of their achievements. This can lead to public trust eroding faster than a sandcastle at high tide. In media, sensationalized statistics can create panic or unwarranted optimism, pushing narratives that don’t hold water. If you want to dive deeper into these issues, the book “Statistics Done Wrong” by Alex Reinhart offers a thorough exploration of common statistical mistakes and how to avoid them.
Take the infamous studies that claimed vaccines cause autism. Misleading data from a single, now-discredited study sent shockwaves through the public. The ramifications? Decreased vaccination rates and, consequently, outbreaks of preventable diseases. This is the power of misleading statistics: they can endanger lives.

Importance of Transparency
In a world rife with data manipulation, transparency stands as a beacon of hope. Open data initiatives play a pivotal role in building public trust. When organizations share raw data, it allows independent verification. Think of it as opening the curtains in a dark room—suddenly, you can see the truth!
Transparency in statistical reporting means that anyone can scrutinize the methods and data used. This scrutiny is vital. It encourages accountability and fosters a culture of honesty. Many governmental and non-profit organizations have embraced open data to promote transparency. This allows citizens to engage with data and draw their own conclusions.
Ethical guidelines exist for statisticians and researchers to ensure data integrity. The American Statistical Association, for instance, emphasizes the importance of honesty, integrity, and transparency. These guidelines remind statisticians to avoid misleading interpretations and to communicate uncertainty clearly. They serve as a compass, guiding researchers through the murky waters of data analysis.
With the rise of technology and big data, ensuring ethical practices in statistical reporting has never been more critical. The data-driven world we live in demands rigorous ethical standards. By adhering to these guidelines, we can help maintain the integrity of statistics, ensuring they serve their true purpose: to inform and educate.
In conclusion, the ethical landscape of statistical reporting is fraught with challenges. Misleading statistics can distort truths and lead to harmful consequences. Conversely, transparency fosters trust and accountability. By championing ethical practices, we can harness the true power of statistics for the greater good, ensuring that our decisions are based on sound, truthful data.

The Role of Critical Thinking
Encouraging Skepticism
Statistics can seem like magic. Numbers appear, conclusions pop out, and sometimes, it feels like smoke and mirrors. That’s why skepticism is your best friend. Always question the data. Where did it come from? Who collected it? Even the most polished graphs can hide a multitude of sins. It’s essential to dig a little deeper than the surface.
Think of it like a detective story. Just because the data says something doesn’t mean it’s gospel truth. A critical approach helps prevent you from falling for flashy figures that might not have the whole picture. So, wear your detective hat and scrutinize those numbers!

Tools for Analysis
Fear not, brave statistician! You don’t have to analyze data with just your wits. There are tools at your disposal that make this task easier and more accurate. For starters, software like R and Python provides robust libraries for statistical analysis. Not a coder? No problem! User-friendly platforms like Excel and Google Sheets have features that can handle basic statistical tasks.
Data visualization tools like Tableau or Power BI make it easier to understand complex data. They convert boring spreadsheets into colorful, interactive charts. Trust me; your audience will thank you. Plus, online resources like Khan Academy and Coursera offer courses to sharpen your statistical skills. If you’re interested in improving your data visualization skills, consider getting “Tableau 2020 for Beginners”. It’s a great way to dive into data visualization!
All these tools arm you with the ability to interpret data effectively. With the right resources, you’ll be making sense of statistics like a pro, leaving your friends in awe of your newfound analytical prowess! So, gear up and let the numbers speak for themselves!
Please let us know what you think about our content by leaving a comment down below!
Thank you for reading till here 🙂
All images from Pexels

