Introduction
Statistics often feels like that looming cloud on the horizon. You see it, you dread it, but you can’t escape its rain. Many individuals view statistics as a monstrous subject, filled with complex numbers and perplexing theories. If you’re among the folks who think they absolutely loathe statistics, don’t fret. You’re definitely not alone.
This article is crafted specifically for you—the statistic-averse, the number-shy, and the folks who’d rather watch paint dry than study data. Together, we’ll unravel the mysteries of statistics, making it less daunting and more approachable. Our guiding light will be Neil J. Salkind’s enlightening book, Statistics for People Who (Think They) Hate Statistics. Salkind’s humorous and friendly tone transforms the intimidating world of statistics into a fun and insightful journey.
Understanding statistics can be your secret weapon. Whether you’re in healthcare, business, or even social sciences, statistics play a pivotal role. Imagine being able to interpret data with ease, making informed decisions based on solid evidence. Wouldn’t that be a game-changer? So, why not take a step back from your aversion and give statistics a fair chance? Join us as we break down the barriers and reveal the fascinating world of numbers that can actually benefit you, all while keeping it light and entertaining.

Speaking of secrets, if you’re serious about diving into the world of statistics, consider investing in a Graphing Calculator TI-84 Plus CE. This handy tool can help you visualize complex equations and make calculations a breeze!
Understanding Statistics
What Are Statistics?
Statistics is the science of collecting, analyzing, and interpreting data. It’s like being a detective, but instead of solving crimes, you’re deciphering patterns in numbers. In research and data analysis, statistics help us make sense of the chaos, providing clarity and insight.
There are two main types of statistics: descriptive and inferential. Descriptive statistics summarize data, providing a clear snapshot of what’s happening. Think of it as a “highlight reel” of your data. On the other hand, inferential statistics take it a step further. They help us make predictions and inferences about a larger population based on a sample. It’s like using a small piece of a puzzle to guess what the entire picture looks like. For more on this, you can check out the problem with inferential statistics.
Understanding the difference between descriptive and inferential statistics is crucial for effective data analysis. Learn more about inferential statistics.
Why Do People Hate Statistics?
Ah, the age-old question: Why do people dread statistics? The answer often lies in misconceptions and fears. Many people believe that statistics require advanced math skills, which can be intimidating. Others associate it with tedious calculations and complex formulas that seem to have no real-world application.
Quotes from students paint a vivid picture of this fear. One student mentioned, “I feel like statistics is just a big, scary monster hiding under my bed.” Another exclaimed, “Why can’t we just use math that doesn’t make my brain hurt?” These sentiments resonate with many who think they hate statistics.
But here’s the kicker: statistics can be fun! It’s all about perspective. Instead of viewing it as a monster, let’s think of it as a quirky friend who just needs a little understanding. With the right approach and a sprinkle of humor, statistics can become way more enjoyable and less of a headache. So, put on your detective hat and let’s unravel the secrets of statistics together!
The Importance of Statistics in Everyday Life
Statistics might sound like the boring sidekick in the superhero world of science. But here’s the twist: it’s the unsung hero! Statistics are all around us, influencing decisions in healthcare, business, and social sciences.
In healthcare, think about how doctors use statistics to make life-saving decisions. When a new drug is tested, researchers analyze data from clinical trials. They look at how effective the drug is compared to a placebo. This helps them determine if the drug should hit the market or go back to the drawing board. It’s like being a contestant on a cooking show; only the best dish gets to be served! For a deeper dive into healthcare statistics, see healthcare workplace violence statistics in Virginia.

Statistics in healthcare are crucial for making informed decisions. Explore more about healthcare statistics.
Businesses, too, rely on statistics to stay ahead of the game. For example, when a company launches a new product, it doesn’t just guess what customers want. They analyze market trends, customer feedback, and sales data. This data-driven approach helps businesses tailor their strategies and maximize profits. Imagine trying to bake the perfect cake without a recipe. That’s what running a business without statistics feels like!
Speaking of recipes, if you want to cook up some serious data analysis skills, grab a copy of The Data Science Handbook. It’s your guide to navigating the world of data science and making sense of the numbers!
Social sciences also lean heavily on statistics. Researchers use surveys and experiments to gather data about human behavior. For instance, they might study how social media influences mental health. By analyzing the data, they can draw conclusions and make recommendations. It’s like being a detective, piecing together clues to solve a mystery!
Moreover, statistics play a crucial role in evaluating news articles and research studies. In an age where misinformation spreads faster than a cat video, it’s essential to scrutinize data presented in the media. Understanding statistics allows you to spot patterns, biases, or misleading claims. So, the next time you read an article, channel your inner statistician and ask, “What do the numbers really say?”
In short, statistics are not just for math geeks. They influence our lives in significant ways. Embracing statistics can empower you to make informed choices and critically evaluate information. So, let’s give statistics a round of applause for being the real MVP!

Breaking Down Statistical Concepts
Key Statistical Concepts Simplified
Descriptive Statistics
Descriptive statistics condense data into meaningful summaries. They help us understand a large dataset with just a few numbers. The three key measures of central tendency are mean, median, and mode. For a comprehensive guide on descriptive statistics, check out descriptive statistics in manufacturing plant.
Descriptive statistics provide essential insights into data. Learn more about descriptive statistics.
Mean is the average. You add all the values and divide by the number of values. So if you have test scores of 80, 90, and 100, the mean is 90.
Median is the middle value in a sorted list. If your test scores are 80, 90, and 100, the median is 90. But if you add another score, say 70, the median becomes 85.
Mode is the most frequent value. If your scores are 70, 80, 80, and 100, the mode is 80. It’s like being the most popular kid in school!
Next, we have measures of variability. These tell us how spread out or clustered the data is. The key measures here are range, variance, and standard deviation.
Range is straightforward. It’s the difference between the highest and lowest values. If your scores are 70 and 100, the range is 30. Simple, right?
Variance shows how much the data points differ from the mean. A high variance means the data points are spread out. A low variance means they’re close together.
Standard Deviation is the square root of the variance. It gives you a sense of how much the values deviate from the mean. The smaller the standard deviation, the more consistent the data.
Inferential Statistics
Now, let’s dive into inferential statistics. This area helps us make predictions about a larger population based on a sample. It’s like casting a fishing line into a lake and guessing how many fish are in the whole lake based on your catch.
Hypothesis testing is a core concept here. It involves making an assumption (hypothesis) and testing it against the data. For example, you might hypothesize that a new teaching method improves student performance. You then conduct an experiment and analyze the data to see if your hypothesis holds true.
Confidence intervals provide a range of values that likely contain the true population parameter. If you’re 95% confident, it means there’s only a 5% chance the true value lies outside this interval. It’s like saying, “I’m pretty sure I’ve got this right, but there’s a tiny chance I could be wrong.”
P-values help you determine the significance of your results. A p-value less than 0.05 typically indicates strong evidence against the null hypothesis. In other words, if your p-value is low, your results are likely not due to random chance.
Significance levels are pre-set thresholds that dictate whether or not you reject the null hypothesis. Commonly, researchers use a significance level of 0.05. A p-value below this threshold suggests that your findings are statistically significant.
Understanding these concepts makes statistics less terrifying and more useful. So, next time you hear about a study, you’ll know exactly how to read between the lines!
Common Statistical Tests
Correlation and Regression
Correlation is like a matchmaking service for variables. It shows how two variables relate. If one goes up, does the other follow? This relationship is measured using a correlation coefficient, which ranges from -1 to 1. A value close to 1 means strong positive correlation. A value near -1 indicates a strong negative correlation. Essentially, correlation helps us understand if two things tango together or dance solo.
Linear regression takes it a step further. It’s not just about correlation; it predicts outcomes. Imagine trying to forecast sales based on advertising spend. Linear regression creates a line that best fits the data points. This line helps us understand the relationship and predict future values. It’s like having a crystal ball, but much more reliable!
T-tests and ANOVA
T-tests are the go-to for comparing means between two groups. Want to see if students who study with music score higher than those who study in silence? A t-test will help you find out! It tells you if the difference in means is statistically significant.
ANOVA, or Analysis of Variance, takes things up a notch. When you want to compare means across three or more groups, ANOVA is your best friend. For example, if you want to test the effects of different diets on weight loss, ANOVA can help you figure out if the mean weight loss differs across those diets. With ANOVA, you can find out if at least one group is dancing to a different tune!
Visualizing Data
Data visualization is like dressing up your data for a party. A well-done graph can captivate your audience and make numbers sing. It’s essential because our brains process visuals faster than text. Without visuals, data can feel like a long, boring lecture.
Common types of graphs include bar charts, histograms, and scatter plots. Bar charts display categorical data and make comparisons easy. Histograms show the distribution of numerical data, helping us understand frequency. Scatter plots reveal relationships between two numerical variables. They can illustrate trends and outliers beautifully. So, when it comes to presenting data, remember: a picture is worth a thousand words!

The Role of Software in Statistics
Introduction to Statistical Software
Statistical software is like a superhero for data analysis. Tools like SPSS and R swoop in to save you from the clutches of manual calculations. They simplify complex analyses, making statistics less intimidating. Imagine crunching numbers for hours; sounds exhausting, right? Software takes the grunt work out. You can focus on interpreting results instead! For those interested in SPSS, consider checking macOS IBM SPSS Statistics Fix 28.1.1.
Statistical software can significantly enhance your data analysis capabilities. Learn more about SPSS.
SPSS is user-friendly, perfect for those just starting. Its point-and-click interface makes data management a breeze. R, on the other hand, is like the Swiss Army knife of statistics. It’s powerful for those who love coding and need flexibility in analysis. Both tools help reduce anxiety by automating calculations and providing clear outputs.
Learning to use statistical software can significantly boost your confidence. No more sweating over formulas or number-crunching. With software, you can tackle complex analyses and emerge victorious. So, embrace these tools! They turn statistics from a monster into a manageable pet.

Real-World Applications of Statistics
Statistics in Various Fields
Healthcare
Statistics play a vital role in healthcare. They help assess the effectiveness of treatments and interventions through clinical trials. Picture this: researchers test a new medication. They gather data about patients, their symptoms, and how they respond to the treatment. This data reveals if the medication is a superhero or a sidekick—helping or hindering health.
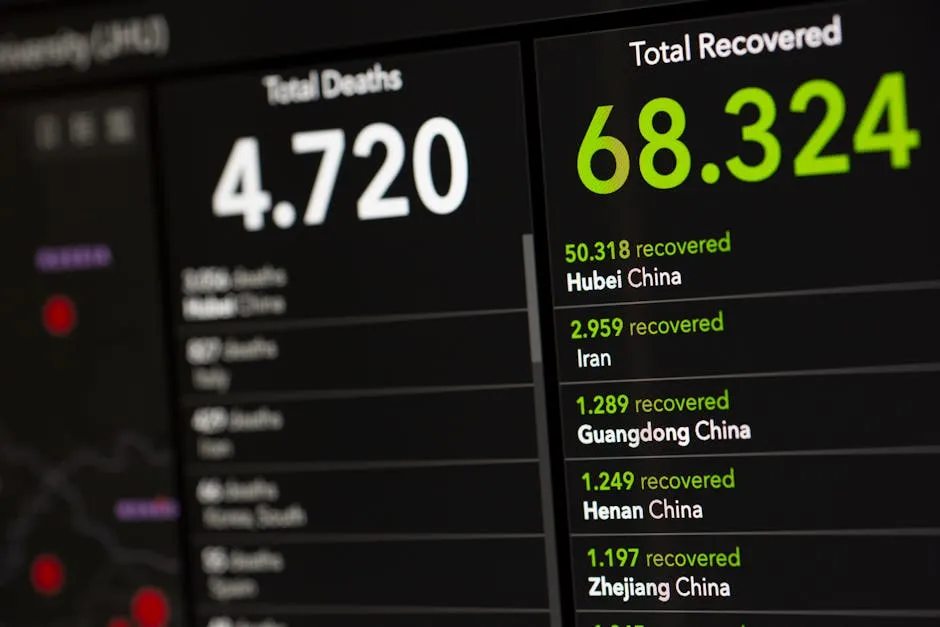
Public health research also relies on statistics. Epidemiologists analyze health trends and disease outbreaks. They use data to determine how diseases spread and which populations are at risk. For instance, during flu season, statistics show vaccination rates and illness prevalence. These insights guide health policies and vaccination campaigns. Without statistics, we’d be flying blind!
Business
In the business world, statistics are like a compass. Companies use data analysis to steer their decisions. Market research is a prime example. Businesses collect data about consumer preferences and behaviors. They analyze this information to identify trends and make informed choices. Want to know if a new product will fly off the shelves? Statistics can provide the answer. For more insights into business statistics, see statistics for business and economics 7th edition.
Statistics are essential for informed business decisions. Explore business statistics.
Data analysis also helps businesses optimize operations. Companies track sales data to spot patterns and improve performance. For instance, if a store notices a spike in ice cream sales during summer, they might increase inventory then. This smart strategy ensures they meet customer demand and maximize profits. Who wouldn’t want to ride the wave of trends?

Education
Statistics are the unsung heroes in education. They help assess student performance and measure educational outcomes. Standardized testing is one area where statistics shine. These tests provide data on student proficiency, helping schools evaluate teaching effectiveness.
Furthermore, educational assessments utilize statistics to improve learning experiences. Teachers analyze test scores to identify areas needing attention. If a class struggles with math, educators can adjust their teaching methods accordingly. This data-driven approach ensures students receive the support they need to succeed.
In addition, educational researchers use statistics to study the impact of various teaching methods. They assess which strategies yield the best results. By analyzing data on student engagement and achievement, they can refine educational practices. In this way, statistics foster a better learning environment for all.
Statistics are everywhere—shaping decisions in healthcare, guiding businesses, and enhancing education. Understanding these applications can transform how we view data. Instead of seeing it as a daunting subject, let’s embrace its power to inform and empower. Statistics truly are the backbone of informed decision-making across diverse fields.
Case Studies
Statistics aren’t just for the mathletes. They can be the unsung heroes of various fields! Here are a few case studies showcasing how statistics changed the game for different industries.
1. Healthcare Innovations: A notable case comes from a clinical trial for a new heart medication. Researchers collected extensive data from thousands of patients. Using statistical methods, they determined the medication reduced heart attack risks by 30%. This finding led to widespread adoption, saving countless lives. It’s a perfect example of how statistics can turn a hypothesis into a life-saving reality.
2. Business Growth: Consider a startup that launched a new app. They used A/B testing—a nifty statistical technique—to evaluate user engagement. By comparing two versions of the app, they found version A had a 25% higher retention rate. This insight allowed the company to focus on refining version A, leading to increased downloads and user satisfaction. Statistics turned a hunch into a profitable decision!
3. Educational Assessments: In education, one school district implemented a new teaching method. To measure its effectiveness, they analyzed student performance data before and after the method was introduced. The results showed a significant improvement in test scores. The district used this statistical evidence to expand the program, positively impacting thousands of students. Here, statistics didn’t just suggest improvement; they made it happen!

Conclusion
Understanding statistics isn’t just a nice-to-have; it’s a must-have in today’s data-driven world! Statistics empower individuals to analyze information critically, make informed decisions, and navigate the complexities of modern life. If you’ve ever felt overwhelmed by numbers, take a deep breath. You’re not alone!
Statistics can seem intimidating, but they hold the key to unlocking insights across fields like healthcare, business, and education. From clinical trials that save lives to market research that drives business success, statistics are truly the backbone of informed decision-making. By grasping statistical concepts, you can transform your understanding of the world around you.
If you think you hate statistics, it’s time to reconsider! Neil J. Salkind’s book, Statistics for People Who (Think They) Hate Statistics, offers an engaging, humorous take on this often misunderstood subject. It breaks down complex ideas into digestible bites, making statistics approachable and fun. You’ll soon discover that statistics can be your ally, not your enemy!
So, why not dive into Salkind’s world of statistics? Explore further resources like Statistical Software SPSS and transform your perception. With the right guidance, you can go from fearing statistics to mastering them. Embrace the power of numbers and watch as they enrich your life in unexpected ways!
FAQs
What if I am really bad at math?
Fear not! Statistics is more about grasping concepts than doing complex math. Many find it helpful to focus on understanding the principles rather than getting lost in calculations. With practice and the right resources, you’ll see that statistics can be quite manageable!
Can I learn statistics on my own?
Absolutely! There are numerous self-study resources available. Online courses, textbooks like Salkind’s, and interactive tutorials can help you learn at your own pace. YouTube also has plenty of helpful videos that make learning statistics engaging and fun.
What are some practical ways to practice statistics?
Consider working on projects that involve analyzing datasets. Websites like Kaggle offer various datasets for practice. You can also conduct surveys among friends or family and analyze the results. Hands-on experience is one of the best ways to solidify your understanding!
How can statistics help in my career?
Statistical literacy is a valuable asset in many professions. Fields like marketing, healthcare, and social sciences rely heavily on data analysis. Being able to interpret statistics can set you apart in job interviews and enhance your decision-making skills in the workplace.
Is there a fun way to learn statistics?
Yes! There are many engaging resources available. Look for educational games and apps that focus on statistical concepts. Websites like Stat Trek and Khan Academy offer interactive lessons that make learning statistics enjoyable. Who said numbers can’t be fun?
Please let us know what you think about our content by leaving a comment down below!
Thank you for reading till here 🙂
All images from Pexels

