Introduction
The Snellen chart is a vital tool for testing visual acuity. It helps determine how well you can see letters at a specific distance. Developed by Dutch ophthalmologist Hermann Snellen in 1862, this chart has shaped eye care practices for over a century. Understanding visual acuity is crucial for maintaining overall eye health. To keep your eyes healthy, consider incorporating eye health supplements into your routine.
Summary and Overview
The Snellen chart measures visual acuity using a series of letters called optotypes. Typically found in medical offices, it features 11 lines of letters that decrease in size. Patients read each line from a distance of 20 feet. The smallest line they can read accurately indicates their visual acuity.

Visual acuity is expressed as a fraction, such as 20/20. This means you can see at 20 feet what someone with normal vision sees at 20 feet. A lower number, like 20/40, suggests poorer vision. Conversely, 20/15 indicates better vision. Each line on the chart corresponds to a specific level of visual clarity, providing essential insights into eye health. And if you’re looking to enhance your viewing experience, consider getting some blue light blocking glasses.
The History of the Snellen Chart
Development and Introduction
The Snellen chart originated in 1862, thanks to Dutch ophthalmologist Hermann Snellen. He created it to standardize visual acuity testing. His chart featured letters arranged in a specific pattern, allowing for consistent measurement of eyesight. Initially, it included only the letters C, D, E, F, L, O, P, T, and Z. Since then, the chart has evolved significantly. New variations, such as the rotating “E” chart, emerged to assist illiterate individuals. Today, the Snellen chart remains the gold standard in eye exams, used worldwide to assess vision. If you’re interested in conducting your own tests at home, consider a vision testing kit to keep track of your eyesight.

Historical Context
Before the Snellen chart, measuring visual acuity was quite imprecise. In ancient times, people gauged their eyesight by distinguishing stars or objects at distance. In the 1600s, Benito Daza de Valdes attempted to create a visual clarity test using mustard seeds. Fast forward to the 19th century, and various eye charts began to surface, yet none were standardized. Key figures, including Heinrich Küchler and Edward Jaeger von Jaxtthal, contributed to early testing methods. However, it was Snellen’s chart that finally brought clarity and consistency to measuring visual acuity, marking a pivotal moment in eye care history. And for those late-night reading sessions, an adjustable desk lamp for reading could be your best friend!
How the Snellen Chart Works
Structure of the Chart
The Snellen chart displays a series of letters in decreasing size across 11 lines. Each line corresponds to a specific level of visual acuity. The largest letters appear at the top, while the smallest are at the bottom. The letters used are carefully selected for clarity and recognition, known as optotypes. These optotypes play a critical role in ensuring accurate assessments of vision. The chart is designed for testing from a distance of 20 feet, providing a standard measurement of visual ability.

Testing Procedure
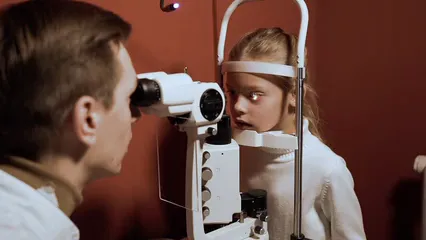
Conducting a visual acuity test with the Snellen chart involves several straightforward steps. First, the patient covers one eye while reading aloud from the top line. This process continues until they can no longer identify the letters. It’s essential to test each eye separately to ensure accurate results. The smallest line read correctly indicates the visual acuity for that eye. Results are expressed as a fraction, such as 20/20 or 20/40. These measurements reveal how well a person sees compared to someone with normal vision, helping eye care professionals identify potential vision issues. If you often find your eyes feeling tired after staring at screens all day, consider using some eye strain relief gel to give your eyes a break.

Understanding Visual Acuity Results
Interpreting the Ratios
Visual acuity is expressed as a ratio, like 20/20 or 20/40. The first number indicates the distance in feet at which you stand from the chart. The second number shows the distance a person with normal vision can see. For example, 20/20 means you see at 20 feet what most can see at that distance. If your score is 20/40, it means you see at 20 feet what someone with normal vision sees at 40 feet.

Different scores can indicate various levels of vision. A score of 20/15 suggests above-average vision, while 20/200 indicates significant impairment. Understanding these ratios helps identify potential vision issues, guiding further evaluation or treatment. And while you’re at it, don’t forget that keeping a record of your eye exams is crucial. An eye exam record book can help you keep track of your vision history.
Common Visual Acuity Standards
Normal vision is defined as 20/20 in the United States. In many countries using the metric system, this is represented as 6/6. Both ratios indicate the same level of visual clarity. However, testing conditions may vary. Factors like lighting, chart distance, and even your state of relaxation can affect results.

In some instances, charts might use different letter types or sizes, impacting readability. It’s essential to ensure a consistent testing environment for accurate assessments. Understanding these standards helps you grasp your eye care needs better. If you’ve got kids, they might benefit from a kids’ vision testing chart that makes the experience fun!
Criticisms of the Snellen Chart
Limitations in Accuracy
The Snellen chart has faced criticism regarding its accuracy and reliability. One major concern is the variance in letter count across different lines. Fewer letters on a line can lead to misleading results, especially in crowded tests. Spacing between letters can also affect how easily they can be read, introducing further inconsistency.

Moreover, the chart’s irregular progression from one line to another may not accurately reflect true vision levels. This inconsistency can make tracking changes in vision more challenging over time. If you’re serious about your eye care, consider investing in an ophthalmoscope set for a deeper look into your eye health.
Alternative Testing Methods
To address these limitations, alternative charts and methods have emerged. For example, the Landolt C chart uses symbols instead of letters, making it easier for patients who may struggle with the alphabet. Other options, like the Bailey-Lovie chart, provide consistent spacing and a more even ratio progression.

These alternatives often lead to more reliable visual acuity assessments. Electronic charts are also becoming common, offering precise readings and flexibility in testing conditions. Adopting these methods can enhance the accuracy of vision testing and provide better insights into eye health. And if you’re looking for a portable solution, a portable vision testing device might be just what you need!
Alternatives to the Snellen Chart
Overview of Other Charts
While the Snellen chart is widely known, several alternatives exist. The Landolt C Chart features a series of circles with a gap. Patients indicate the gap’s direction, making it suitable for those who cannot read letters. This chart is beneficial for various age groups, especially children. Speaking of kids, ensuring they have a comfortable space to read is important. An adjustable reading stand can help them maintain good posture while reading!

Another popular choice is the Bailey-Lovie Chart, which offers consistent letter spacing. Its design allows for more accurate measurements, helping to reduce crowding effects. This chart is particularly useful in clinical settings, providing clear insights into visual acuity.
Each alternative caters to specific populations, ensuring more inclusive testing methods. By using different charts, eye care professionals can identify visual impairments more effectively. And for those who enjoy a little fun while learning about vision, a vision board game could be a great addition to your collection!
Digital and Modern Innovations
Technology has revolutionized visual acuity testing. Electronic charts are now common in clinics, offering adjustable settings for various patients. These digital tools provide precise measurements and can store patient data for future reference. If you’re tech-savvy, you might also enjoy the benefits of smart glasses that can enhance your visual experience!

Additionally, online visual acuity tests are gaining popularity. They allow individuals to test their vision from home. However, while convenient, these tests may not replace professional evaluations. Regular eye exams remain essential for accurate assessments and eye health maintenance. For more insights on how patient data is transforming healthcare monitoring, check out this article on patient data module.
Understanding how patient data can enhance healthcare monitoring is crucial in today’s medical landscape. patient data module
Conclusion
In this article, we examined the Snellen chart, an essential tool for measuring visual acuity. We discussed its structure, historical significance, and how it helps determine eye health. Understanding visual acuity is vital for identifying vision problems early.

Regular eye check-ups play a crucial role in maintaining your overall eye health. They can catch issues before they become serious. Prioritize your eye health by scheduling regular exams with a professional. Remember, your vision is important—don’t take it for granted. And while you’re at it, consider some healthy snack subscription box to keep your body and mind sharp!
What is a Snellen chart?
The Snellen chart is a standard tool for testing visual acuity. It features rows of letters, known as optotypes, that decrease in size. Patients read the letters from a distance of 20 feet. This helps eye care professionals assess how well you can see.
How do you read a Snellen chart?
To read a Snellen chart, cover one eye and read the letters from top to bottom. The smallest line you can read accurately indicates your visual acuity. Results are expressed as a fraction, like 20/20, which compares your vision to standard eyesight.
What are the limitations of the Snellen chart?
The Snellen chart has some criticisms. Variations in letter count can affect accuracy. Spacing issues may lead to misinterpretation of results. Additionally, some feel alternative methods provide more reliable measurements of visual acuity.
Are there online versions of the Snellen chart?
Yes, online versions of the Snellen chart are available for home testing. While they offer convenience, they may not be as accurate as in-office tests. Professional evaluations are still recommended for reliable assessments of your vision.
How often should I have my vision tested?
Generally, adults should have their vision tested every two years. However, if you have risk factors or wear glasses, annual exams are advisable. Children should have regular check-ups to monitor their vision as they grow.
Please let us know what you think about our content by leaving a comment down below!
Thank you for reading till here 🙂
All images from Pexels


