Introduction
Nestled between the San Francisco Bay and the scenic Napa Valley, Vallejo, California, is a city that blends rich history with a vibrant community. With a population of around 123,564 residents, this city has faced its share of challenges, particularly concerning crime rates. Vallejo’s strategic location makes it an attractive place for both residents and businesses, yet it also brings concerns about safety.
Understanding crime statistics is vital for everyone living in Vallejo. For current residents, these stats can dictate their daily lives and influence neighborhood interactions. Potential movers might find these figures crucial when deciding whether to plant roots in this city. Policymakers rely on crime data to create effective safety measures and allocate resources.
This article aims to provide a comprehensive overview of Vallejo’s crime statistics. We’ll compare these figures against national and state averages, shedding light on the elements that influence these trends. From violent crimes to property offenses, the goal is to paint a clear picture of Vallejo’s safety landscape.

Crime Overview
General Crime Statistics
Vallejo has an overall crime rate of 52 per 1,000 residents, placing it among the highest in the nation. In fact, over 97% of communities in California report lower crime rates than Vallejo. The total number of crimes reported in the city reaches approximately 6,485 annually.
With a population of about 123,564, this means that the chances of becoming a victim of either violent or property crime in Vallejo are alarmingly high, standing at one in 19. For context, the national average for total crime is significantly lower, showcasing Vallejo’s unique challenges regarding safety.
Speaking of unique challenges, if you’re interested in exploring the psychology behind crime, you might want to check out Mindhunter: Inside the FBI’s Elite Serial Crime Unit. This gripping read dives deep into the minds of criminals and the agents who track them down. It’s perfect for anyone curious about the darker side of human nature!

Violent Crime Statistics
Diving into the specifics, Vallejo’s violent crime rate is approximately 9.83 per 1,000 residents, which far exceeds the national median of 4 per 1,000. Here’s a breakdown of the types of violent crimes reported:
- Murder: 22 incidents (0.18 per 1,000 residents)
- Rape: 90 incidents (0.73 per 1,000 residents)
- Robbery: 362 incidents (2.93 per 1,000 residents)
- Assault: 741 incidents (6.00 per 1,000 residents)
When comparing these figures to state averages, Vallejo’s violent crime rates are notably higher. For instance, California’s overall violent crime rate averages 4.99 per 1,000 residents, making Vallejo’s statistics startling.
If you’re intrigued by the darker tales of true crime, you might enjoy The Stranger Beside Me, a chilling account that delves into the life of a serial killer who was also a friend. It’s the perfect companion for those long nights when you just can’t sleep!

Property Crime Statistics
Property crime in Vallejo is another area of concern, with a rate of 42.65 per 1,000 residents. This is significantly higher than California’s average and the national average, highlighting a pressing issue for local law enforcement. Breaking it down further:
- Burglary: 905 incidents (7.32 per 1,000 residents)
- Theft: 3,215 incidents (26.02 per 1,000 residents)
- Motor Vehicle Theft: 1,150 incidents (9.31 per 1,000 residents)
These figures indicate that residents face a considerable risk of becoming victims of property crime, with chances at one in 23. Overall, the crime landscape in Vallejo reveals a city grappling with significant challenges, making it essential for residents and potential movers to stay informed.
For those looking to enhance their home security, consider investing in a Home Security Camera System. With the right surveillance in place, you can keep an eye on your property and deter potential thieves. Because who doesn’t want to feel like a secret agent in their own home?

Crime Trends and Analysis
Yearly Trends
Vallejo’s crime statistics show a complex narrative. In recent years, crime rates have fluctuated, and understanding these trends is crucial for residents and policymakers alike. The overall crime rate in Vallejo stands at 52 per 1,000 residents, significantly higher than the national average. Over the past few years, this rate has seen a mix of upticks and declines across various categories.
From 2021 to 2022, the total crime rate in Vallejo increased by 22%. Notably, property crime surged by 28.6%, while violent crime saw a slight decrease of 0.4%. This juxtaposition highlights a concerning trend: while residents might feel slightly safer from violent crime, they face greater risks of property offenses.
Examining specific categories, the murder rate saw 22 incidents last year, with a per capita rate of 0.18. This number is alarming, especially when compared to California’s average of 17.8. Rape incidents totaled 90, equating to 0.73 per 1,000 residents, still above the national average. Robberies and assaults also contribute significantly to Vallejo’s violent crime landscape.
Conversely, property crimes reveal more dramatic shifts. The city reported 3,215 thefts, translating to an eye-watering 26.02 per 1,000 residents. Vallejo’s property crime rates are 117% higher than the national average, making it critical for residents to adopt preventive measures. Understanding these fremont crime statistics can help in assessing safety in the area.

Examining local crime statistics is essential for understanding safety trends. fremont crime statistics provide valuable insights into regional safety concerns.
Factors Influencing Crime Rates
Economic Conditions
Economic factors play a pivotal role in shaping Vallejo’s crime rates. As of 2023, the unemployment rate in Vallejo hovers around 4.7%, slightly above the national average. High unemployment often drives individuals towards crime as a means of survival. Additionally, the cost of living in Vallejo is 28.33% above the national average. This financial strain can lead to increased property crimes, as residents struggle to make ends meet.

Community Issues
Community dynamics also contribute to Vallejo’s crime statistics. Gang activity remains a significant concern, with an estimated 1,000 members across approximately 40 gangs in the city. Gang-related violence has escalated in recent years, with eight out of 28 homicides in 2020 being gang-related. This rise in gang activity correlates with higher rates of violent crime.
Substance abuse is another pressing issue. Vallejo has reported the highest rates of substance abuse-related hospitalizations in Solano County. This problem not only affects individuals but also exacerbates crime rates, as drug-related offenses often lead to thefts and assaults. Poverty levels, with approximately 15.4% of residents living below the poverty line, further compound these challenges.

If you’re looking for an insightful read on the intersection of race and crime in America, The New Jim Crow: Mass Incarceration in the Age of Colorblindness by Michelle Alexander is a must-read. It addresses the systemic issues surrounding crime and punishment in society, shedding light on how these dynamics impact communities.
Law Enforcement
The effectiveness of local law enforcement significantly impacts crime rates. Vallejo has approximately 123 police officers, translating to about 1.0 officer per 1,000 residents. This figure falls short of California’s average of 2.30 officers per 1,000. The staffing shortages hinder the police department’s ability to respond effectively to crime, leading to community frustration regarding safety.
In response to these challenges, initiatives like Project HOPE aim to engage community members and improve police relations. The project focuses on reducing youth violence and gang activity while enhancing community safety through collaboration and support.

Comparison with Other Cities
Vallejo vs. Nearby Cities
When comparing Vallejo’s crime rates to nearby cities, the differences are stark. The following table illustrates this comparison:
| City | Violent Crime Rate (per 1,000) | Property Crime Rate (per 1,000) |
|---|---|---|
| Vallejo | 9.83 | 42.65 |
| Benicia | 0.56 | 1.96 |
| American Canyon | 1.25 | 2.89 |
| Fairfield | 2.57 | 25.38 |
As illustrated, Vallejo’s violent crime rate surpasses that of its neighbors significantly. Benicia and American Canyon boast much safer environments, with their violent crime rates far below Vallejo’s.

Safety Perception
Safety perceptions also vary widely. According to local surveys, only 18% of respondents in Vallejo feel secure, while a staggering 82% express concerns over safety. This perception aligns with crime statistics, as many residents feel uncomfortable walking alone at night. In contrast, nearby cities like Benicia enjoy a much more favorable perception of safety, with a majority of residents feeling secure in their surroundings.
In summary, the crime trends in Vallejo paint a picture of a city grappling with significant challenges. The combination of economic conditions, community issues, and law enforcement effectiveness contributes to a complex crime landscape, making it essential for residents to stay informed and proactive about their safety.

Safe Neighborhoods in Vallejo
Overview of Safe Areas
When it comes to finding a safe haven in Vallejo, certain neighborhoods shine like beacons of hope amidst the crime statistics. Glen Cove and Heather Ridge stand out as two of the city’s safest areas. Glen Cove boasts picturesque views of the waterfront and tight-knit community vibes, making it a delightful place to reside. Residents here often feel a sense of camaraderie that extends beyond their front yards.
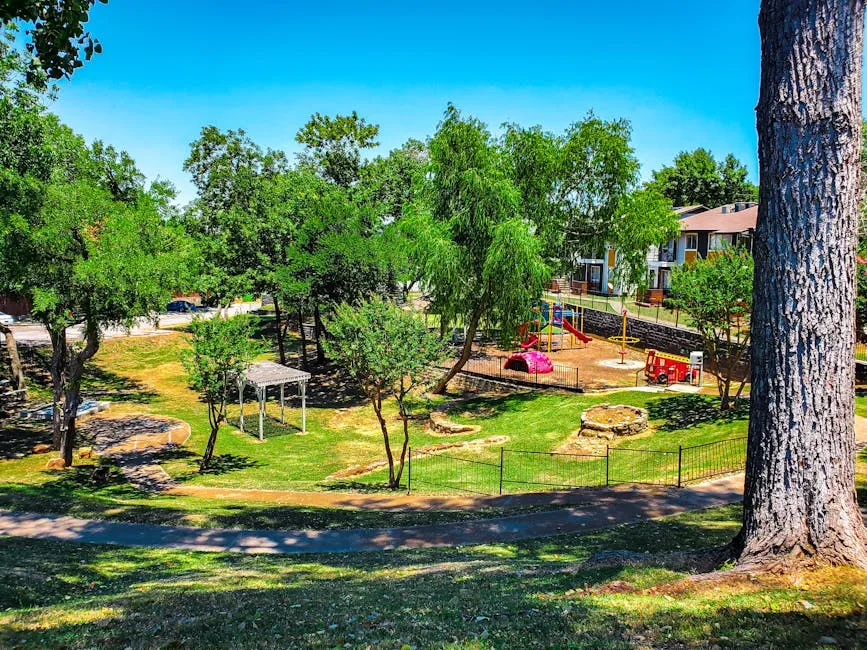
Heather Ridge, on the other hand, offers tranquility and a family-friendly atmosphere. This neighborhood features well-maintained parks and recreational facilities, perfect for weekend picnics or evening strolls. Families flock to these areas, drawn by the promise of safety and a sense of belonging in the community.
But wait, there’s more! Other notable safe neighborhoods include Madigan Southwest, Madigan West, and Granada Heights. Each of these areas provides a unique charm and character, making them attractive to those seeking refuge from the city’s crime challenges.
Safety Initiatives
Vallejo isn’t just sitting back and hoping for the best. City officials and community members have banded together to implement various safety initiatives aimed at improving the overall security of these neighborhoods. One notable effort is Project HOPE, which focuses on reducing gang violence and promoting community-police relations. By encouraging collaboration between law enforcement and residents, this initiative aims to enhance trust and safety.
Additionally, local community organizations have stepped up to host neighborhood watch programs and safety workshops. These programs empower residents to take an active role in their neighborhood’s safety. With crime trends changing, it’s crucial for residents to be vigilant and informed.

To sum it up, neighborhoods like Glen Cove and Heather Ridge shine brightly in Vallejo’s landscape. With community engagement and proactive safety measures, these areas continue to foster a sense of security. Residents can enjoy their surroundings, knowing that they are part of a concerted effort to maintain safety in their beloved neighborhoods. So, if you’re considering a move to Vallejo, these neighborhoods could be just the ticket to a safer lifestyle!
Law Enforcement Strategies
Policing in Vallejo is evolving. Local law enforcement agencies have embraced various strategies to tackle crime effectively. One of the standout methods is community policing. This approach encourages police officers to build relationships with residents. They aren’t just enforcers; they are neighbors, friends, and partners in safety. This strategy helps to foster trust and open communication, making it easier for the community to report crimes.
Vallejo has also rolled out violence reduction programs. These initiatives focus on high-risk areas and aim to minimize gang-related activities. By targeting the root causes of crime, such as poverty and lack of education, these programs strive to create a safer environment for everyone. The city collaborates with local organizations to provide resources and support for at-risk youth. After all, a well-supported young person is less likely to turn to crime.
Moreover, Project HOPE is a significant community-based crime reduction initiative. Launched to address gun violence and gang-related incidents, it aims to enhance community-police relations. By implementing strategies like youth engagement and recreational programs, Project HOPE helps to deter crime before it starts.
These law enforcement strategies show promise. They reflect a commitment to improving safety in Vallejo. However, success relies on active community involvement and ongoing dialogue between residents and law enforcement.

Conclusion
Vallejo’s crime statistics present a mixed bag of challenges and opportunities. The city grapples with a total crime rate of 52 per 1,000 residents, significantly higher than national averages. These numbers reveal a pressing need for community action and effective law enforcement strategies. With over 6,485 reported crimes annually, it’s clear that safety remains a top concern for residents.
Violent crime rates are notably alarming. At 9.83 per 1,000 residents, Vallejo’s violent crime rate exceeds both California and national averages. Key categories, such as robbery and assault, contribute heavily to this statistic, underscoring the importance of targeted law enforcement efforts.
On the property crime front, Vallejo also faces significant challenges. With a property crime rate of 42.65 per 1,000 residents, residents are at substantial risk. Burglary, theft, and motor vehicle theft are prevalent, creating an urgent need for effective community safety measures.
Despite these daunting statistics, there is hope. Initiatives like Project HOPE and community policing foster collaboration and trust. As residents and law enforcement work hand in hand, they can create safer neighborhoods and reduce crime rates.

The journey to improved safety in Vallejo requires consistent community engagement. Residents must remain informed and proactive in sharing concerns with law enforcement. By participating in local initiatives and neighborhood watch programs, they can play a vital role in crime prevention.
In summary, Vallejo’s crime statistics highlight the need for ongoing efforts. With a combination of community involvement and strategic law enforcement, the city can work towards a safer future. Emphasizing collaboration and understanding will lead to better outcomes for all. Let’s keep the lines of communication open and continue striving for a brighter, safer Vallejo.
FAQs
What are the most common crimes in Vallejo?
Vallejo experiences high rates of property crimes, particularly theft, burglary, and motor vehicle theft. Violent crimes such as robbery and assault are also significant concerns for residents.
How does Vallejo’s crime rate compare to other cities in California?
Vallejo’s crime rate is notably higher than many California cities. It ranks among the top 100 most dangerous cities in the U.S., with crime rates exceeding both state and national averages.
What measures can residents take to stay safe in Vallejo?
Residents can enhance their safety by participating in neighborhood watch programs, staying informed about local crime trends, and fostering relationships with law enforcement. Being aware of surroundings and reporting suspicious activity can also help.
Where can I find more detailed crime reports for specific neighborhoods?
For detailed crime reports, residents can access local law enforcement websites, which often provide crime mapping tools and community crime statistics. NeighborhoodScout and AreaVibes are also valuable resources for finding localized crime data.
Please let us know what you think about our content by leaving a comment down below!
Thank you for reading till here 🙂
All images from Pexels

